Getting Graphic: Representing Representations in Humanities and Sciences
Preview:
INTRODUCTION: GOOGLING GRAPHS
A Google search for the prompt “graphs are…” yields the following results: the best way to summarize data, visual representations of what, everywhere, often constructed from tables of information, and what of relationships. These fragmentary results illustrate the various approaches to graphs by different fields of research and institutional practices, as well as common conceptions regarding their purpose and value. In the article “Graphs, Maps, Trees,” Franco Moretti argues for a quantitative approach to illustrating literary trends; a shift from hermeneutic practices around individual texts to a quantitative analysis of literature (67). Introducing graphic displays of literary information exposes the field of literary studies to the questions aforementioned, not only is the question what the display shows but how and why its modality functions and what are the implications regarding power relations. What are the politics of graphing and how do they relate to the respective fields of humanities and sciences? Why does quantitative analysis in literature warrant such a “revolutionary” sentiment?
LITERARY LIKENESS: GRAPHS IN HUMANITIES
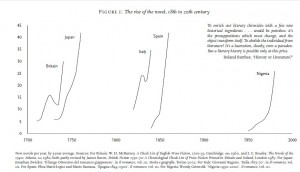
In “Graphs, Maps, Trees” Moretti employs a combination of line and bar graphs to illustrate his empirical analysis of the rise and fall of the novel. “Figure 1: The rise of the novel, 18th to 20th century” depicts increases in literary production in Britain, Japan, Italy, Spain, and Nigeria over 300 years with specific clustering effects (Moretti 69).
Moretti introduces the scholars whose data will provide the basis for the graph at the start of the section two, several lines before referencing Figure 1 in text and a page before the actual illustration (68-69). The contextualization then appears before the reader encounters the graph, and is repeated in the figure caption which also lists the sources, as is captured by Figure 1 above. This reiteration of source material provides an emphasis on validity and traditional scholarly methods, that by referencing accepted scholarly work the author’s own hypothesis or statement is by connection authorized as well. Joseph Bensman discusses the elitism of footnotes whereby one must cite another scholar who is “equal or higher in prestige” in order to gain legitimacy (450), the data sources for Moretti’s graph work similarly. The graph and its data sources connote power relations precluding contradictions and complexities of authorship and authority, as power exerts its forces in humanities research through the figure of the Author-god. Bensman states that “footnotes have important institutional, “political” and aesthetic functions” (443); similarly these functions are also influenced by and through the graphs presented. The aesthetics as well as the political functions assert the graph’s authoritative dominance, Moretti uses a quote from lauded scholar Roland Barthes to champion the removal of the subjective from his analysis and thus this quote corroborates the quantitative analysis methodology (69).
BATTLEDOME: SCIENCE VS. ARTS
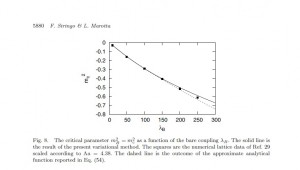
Moretti states that “graphs are not models; they are not simplified versions of a theoretical structure in the way maps and (especially) evolutionary trees” are (72): graphs are relations. Moretti both supports and contradicts this thesis with his own graphs; although they do illustrate relations between the numbers of books produced and the books’ locations, the accuracy as well as the reliance on traditional scholarly validation subverts the radical claims. Cosma Shalizi criticizes Moretti’s methods, arguing that Moretti should have analysed the data himself and mathematically calculated the probabilities for clustering occurrences and errors (118). This argument represents the burgeoning issue of transplanting quantitative analysis methods from science based research to literary practices. If Moretti’s data sources are proven wrong, or if his methods are found faulty then his argument for literary quantitative analysis can be refuted. An example of traditional scientific graphs is found in Figure 2, taken from a scholarly paper on Higgs modelling, a scientific phenomena which, as the paper attempts to prove, can be adequately imagined through specific microscopic structures called crystal lattices (Siringo 5880).
Regardless of its scientific meaning, the graph connotes several key statements which illustrate the shortcomings and successes of Moretti’s quantitative analysis. The line graph uses the caption to describe the phenomena and its graphic representation, it does not refer to outside sources for validity of previous results. Secondly, error is factored into the illustration by the size of the data points as well as the predicted function (the dashed line). By encrypting the graph with secondary information that is accessible through the primary study, the scientific graph elucidates the conceptualization process, turning to transparency for validation and allowing the reader to deduce its value rather than relying purely on precedent research.
Yet the scientific graph reinforces power relations by assuming the reader is adhering to the conventions of reading graphs, for example understanding that larger data points mean more possible error. Audience influences the output, the graph and caption describe sets of social relations and systems, discursive sets in a Foucaultian sense. In Andrew Piper’s article “Reading’s Refrain: From Bibliography to Topology” he suggests literary topology, which analyses the text not through hermeneutics but by assigning values to the lexicographic elements and represents them visually, signals an inspection of places in which literature intersects with other types of social strata and discursive readings (394). The inability to escape power relations through graphs, both in the humanities and sciences, highlights the connection between the process of academic research, Authorship (as in the panoptic) and social rules. Moretti hypothesizes that “quantification poses the problem… and form offers the solution” (86) which can be compared to concept of literary topology. Literary topology, as Piper illustrates in the Goethe graph, performs a similar function to work of Moretti’s graph, preferring quantitative data to the interpretative techniques (385), exhibiting shifting power relations between Author and reader that allow the reader more authority. This also is present in the scientific article, as form is contextualized later in the Higgs paper, when the discussion reveals the equation for the line graph and its derivation, evoking specific associations to fields of study and popularized theories. Therefore the graph summarizes the data while reflecting the environment in which it was constructed, physically from the digital program which produces the equation to the politics of theory behind the illustration.
HYBRIDIZATION STATION
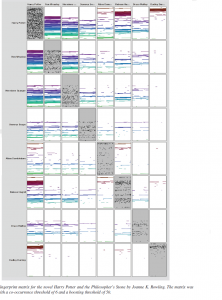
Moretti’s graph attempts to convey more than one set of data results, i.e. more than one line segment. The results represent a comparison between countries and publication numbers, yet temporally they do not provide a cohesive linearity and further inference on the part of the reader is required. The article “Fingerprint Matrices: Uncovering the dynamics of social networks in prose literature” examines inter-character relations and compares these relations between novels, such as The Queen’s Tiara by Carl Jonas Love Almquist and J.K. Rowling’s Harry Potter and the Philospher’s Stone. Although the articles’ subject matter is slightly different, both propagate quantitative analysis of relations as the main analytic form; the graphs included illustrate the shift in methodologies and as such Piper’s concept that topology is the analysis of ratio rather than difference (379).
“Fingerprint Matrices” presents material in a radically different graphic form than in the Moretti article, it uses matrix graphs to visual social networks. Ratio is “knowledge of the relational and the scalar, the co-presence of difference” (Piper 382); this is witnessed in the Harry Potter matrix graph which highlights the relationships between characters as well as their placement within the novel and subsequently their importance in the plot. With multiple goals the graphing structures must change as the two dimensional line graph used by Moretti is no longer able to display the information, and thus fingerprint matrices (as seen in Figure 3) are created instead (Oelke 372), becoming visualizations of text.
Alongside the fingerprint matrices are the researcher’s methodologies and background sections. The latter section (which cites Moretti) again displays the typical academic posturing, however it is more concise than previous essays examined. The methodologies section describes data collection, processing and graphic output, something which is markedly absent from Moretti’s section two-Figure 1 relationship. Piper states “when we read topologically we are reading our way through language’s historical entanglements,” (Piper 378) therefore the fingerprint matrices not only examine the repetition of Harry Potter characters, but the changes in research illustrations and performs a conjoining of theory and criticism (Piper 389). By producing a methodology whereby all its mechanisms become pellucid the validity of traditional research in humanities changes. No longer do the citations hold substantial authoritative power, but the empirical data and its representations are available for the reader to evaluate the efficacy of the results. Therefore the modifications of the mechanism and its display alter the researcher’s writing as well as the traditional outline of literary articles, which now use methodology and discussion section headings.
Conversely, the opposite argument can be made, that the articles modify the methods; these texts are located in digital domains. All three graphs outputs are digitally rendered, the scientific graph and fingerprint matrices both disclose the graphing procedures which use programs to sift and organize data. By analyzing the pixilation of the lines and the familiar settings of LaTEX, Moretti’s graphappe ars to be constructed via computer program. Digital graphs now require the reader to examine new elements, such as the efficiency of graphing programs or the image resolution in order to discern veracity and value. A further discursive set creates the authoritative relations between journals and readers, another power relation that highlights the function of graphs in scholarship. Currently these articles are available online through Science Direct and the Arts and Humanities Databases, which limits use to university affiliations yet still disseminates the material to a larger audience than through paper production. As quantitative analysis opens more possible readings to literature, the ‘entanglements’ of objects grow; the graphs emphasize the rules of literary production and character relations, rather than the meaning and the objects themselves, reflecting the increased multiplicity of articles and journals available. This perhaps addresses Piper’s question “what does it mean to read electronically?” (373); digital reading utilizes electronic resources and thus makes conscious our academic practices of reading in humanities research. Ultimately more questions remain, those still left unanswered include: how do these academic objects move through popular culture? Where are the intersections between fields of research in regards to graphing techniques? Does digital production of methods alter the function of research?
Works Cited
Bensman, Joseph. “The Aesthetics and Politics of Footnoting.” International Journal of Culture, Politics, and Society 1.3 (1988): 443-470. Web.
Munroe, Randall. “Tall Infographics.” XKCD.com. October 4, 2013. Web. October 19, 2013.
Moretti, Franco. “Graphs, Maps, Trees.” New Left Review 24 (Nov-Dec 2003): 67-913 Web.
Oelke, D., D. Kokkinakis and D.A. Keim. “Fingerprint Matrices: Uncovering the dynamics of social networks in prose literature.” Eurographics Conference on Visualization 32.3. Ed. B. Preim, P. Rheingans and H. Theisel. Oxford: Blackwell Publishing, 2013. Web.
Piper, Andrew. “Reading’s Refrain: From Bibliography to Topology.” English Literary History 80 (2013): 373-399. Web.
Shalizi, Cosma. “Graphs, Trees, Materialism, Fishing.” Reading Graphs, Map, Trees: Responses to Franco Moretti. Ed. Jonathan Goodwin and John Holbo. Anderson: Parlor Press, 2011. 115-139. Web.
Siringo, Fabio and Luca Marotta. “Nonperturbative Effective Model for the Higgs Sector of the Standard Model.” International Journal of Modern Physics A 25.32 (2010): 5865-5884. Web.


