Bootcamp: Our Humanities Theorists Tree-mapped
Bootcamp + Trees + Nov 7
“There is a constant branching-out, but the branches also grow together again, wholly or partially, all the time.” – Alfred Kroeber, Anthropology
Experiencing our class thus far, I must say it’s been less painful then expected to get my mind inside the theory circle. Once I became familiar with the ‘big names’ and most of the prevalent terms and ideas, everything became much easier. The circulatory nature of theory in the Humanities is evident as you read repeated names and quotes cited in each of our readings. And, as the semester has worn on, it has already become clear to me who speaks loudest to my sensitivities, my ways of working and my intuition. I have favorites: theorists I’ll keep tabs on and those I probably won’t. It’s the same for them. Some drool over Foucault while other go for Delueze and Guattari.
Franco Moretti had me at ‘graphs’.
This last series of Graphs, Maps, Trees is right up my alley because I am an intensely visual learner and communicator. Moretti gave us darn good reasons as to why this use of quantitative data and its visual representation add something to the textual humanities and can give us a new way of seeing. Of Graphs, Maps, Trees, I’m most interested in Trees. It probably has to do with my subject of study and its long lineage or my penchant for trees themselves. The graphs here feel less rigid, more organic and illustrate the more ‘messy’ bits of quantitative data better. Either way, I knew it was the perfect form for my latest question: the lineage of thought.
For this week’s Bootcamp, I’d like to experiment with our own syllabus. Who/what are we reading and what did those people read? How is the flow of theory/knowledge passed down to us and how do we become a part of it? Who inspired those who inspire me?
So, I made a tree graph.
I chose to do this with my own artistic interpretation because 1) I’m horrible with computer programs, 2) It’s dead fun to cartoonize the serious theorists we’ve been reading*, 3) We can see how the cartographer’s bias can influence our interpretation of the information. My method was similar to Moretti’s method of plotting Hamlet in next week’s Network article: I went through all of the readings and marked down each writer’s direct positive references within the articles we’ve read. If there was no obvious citation, I went online and did a search to see who their biggest influences were. I, by no means, exhausted these articulations. Sadly, I had to make many omissions and simplifications in order to fit it on the page. JP Harvey’s Deconstructing the Map and its warnings about the cartographer’s inherent bias is well taken.
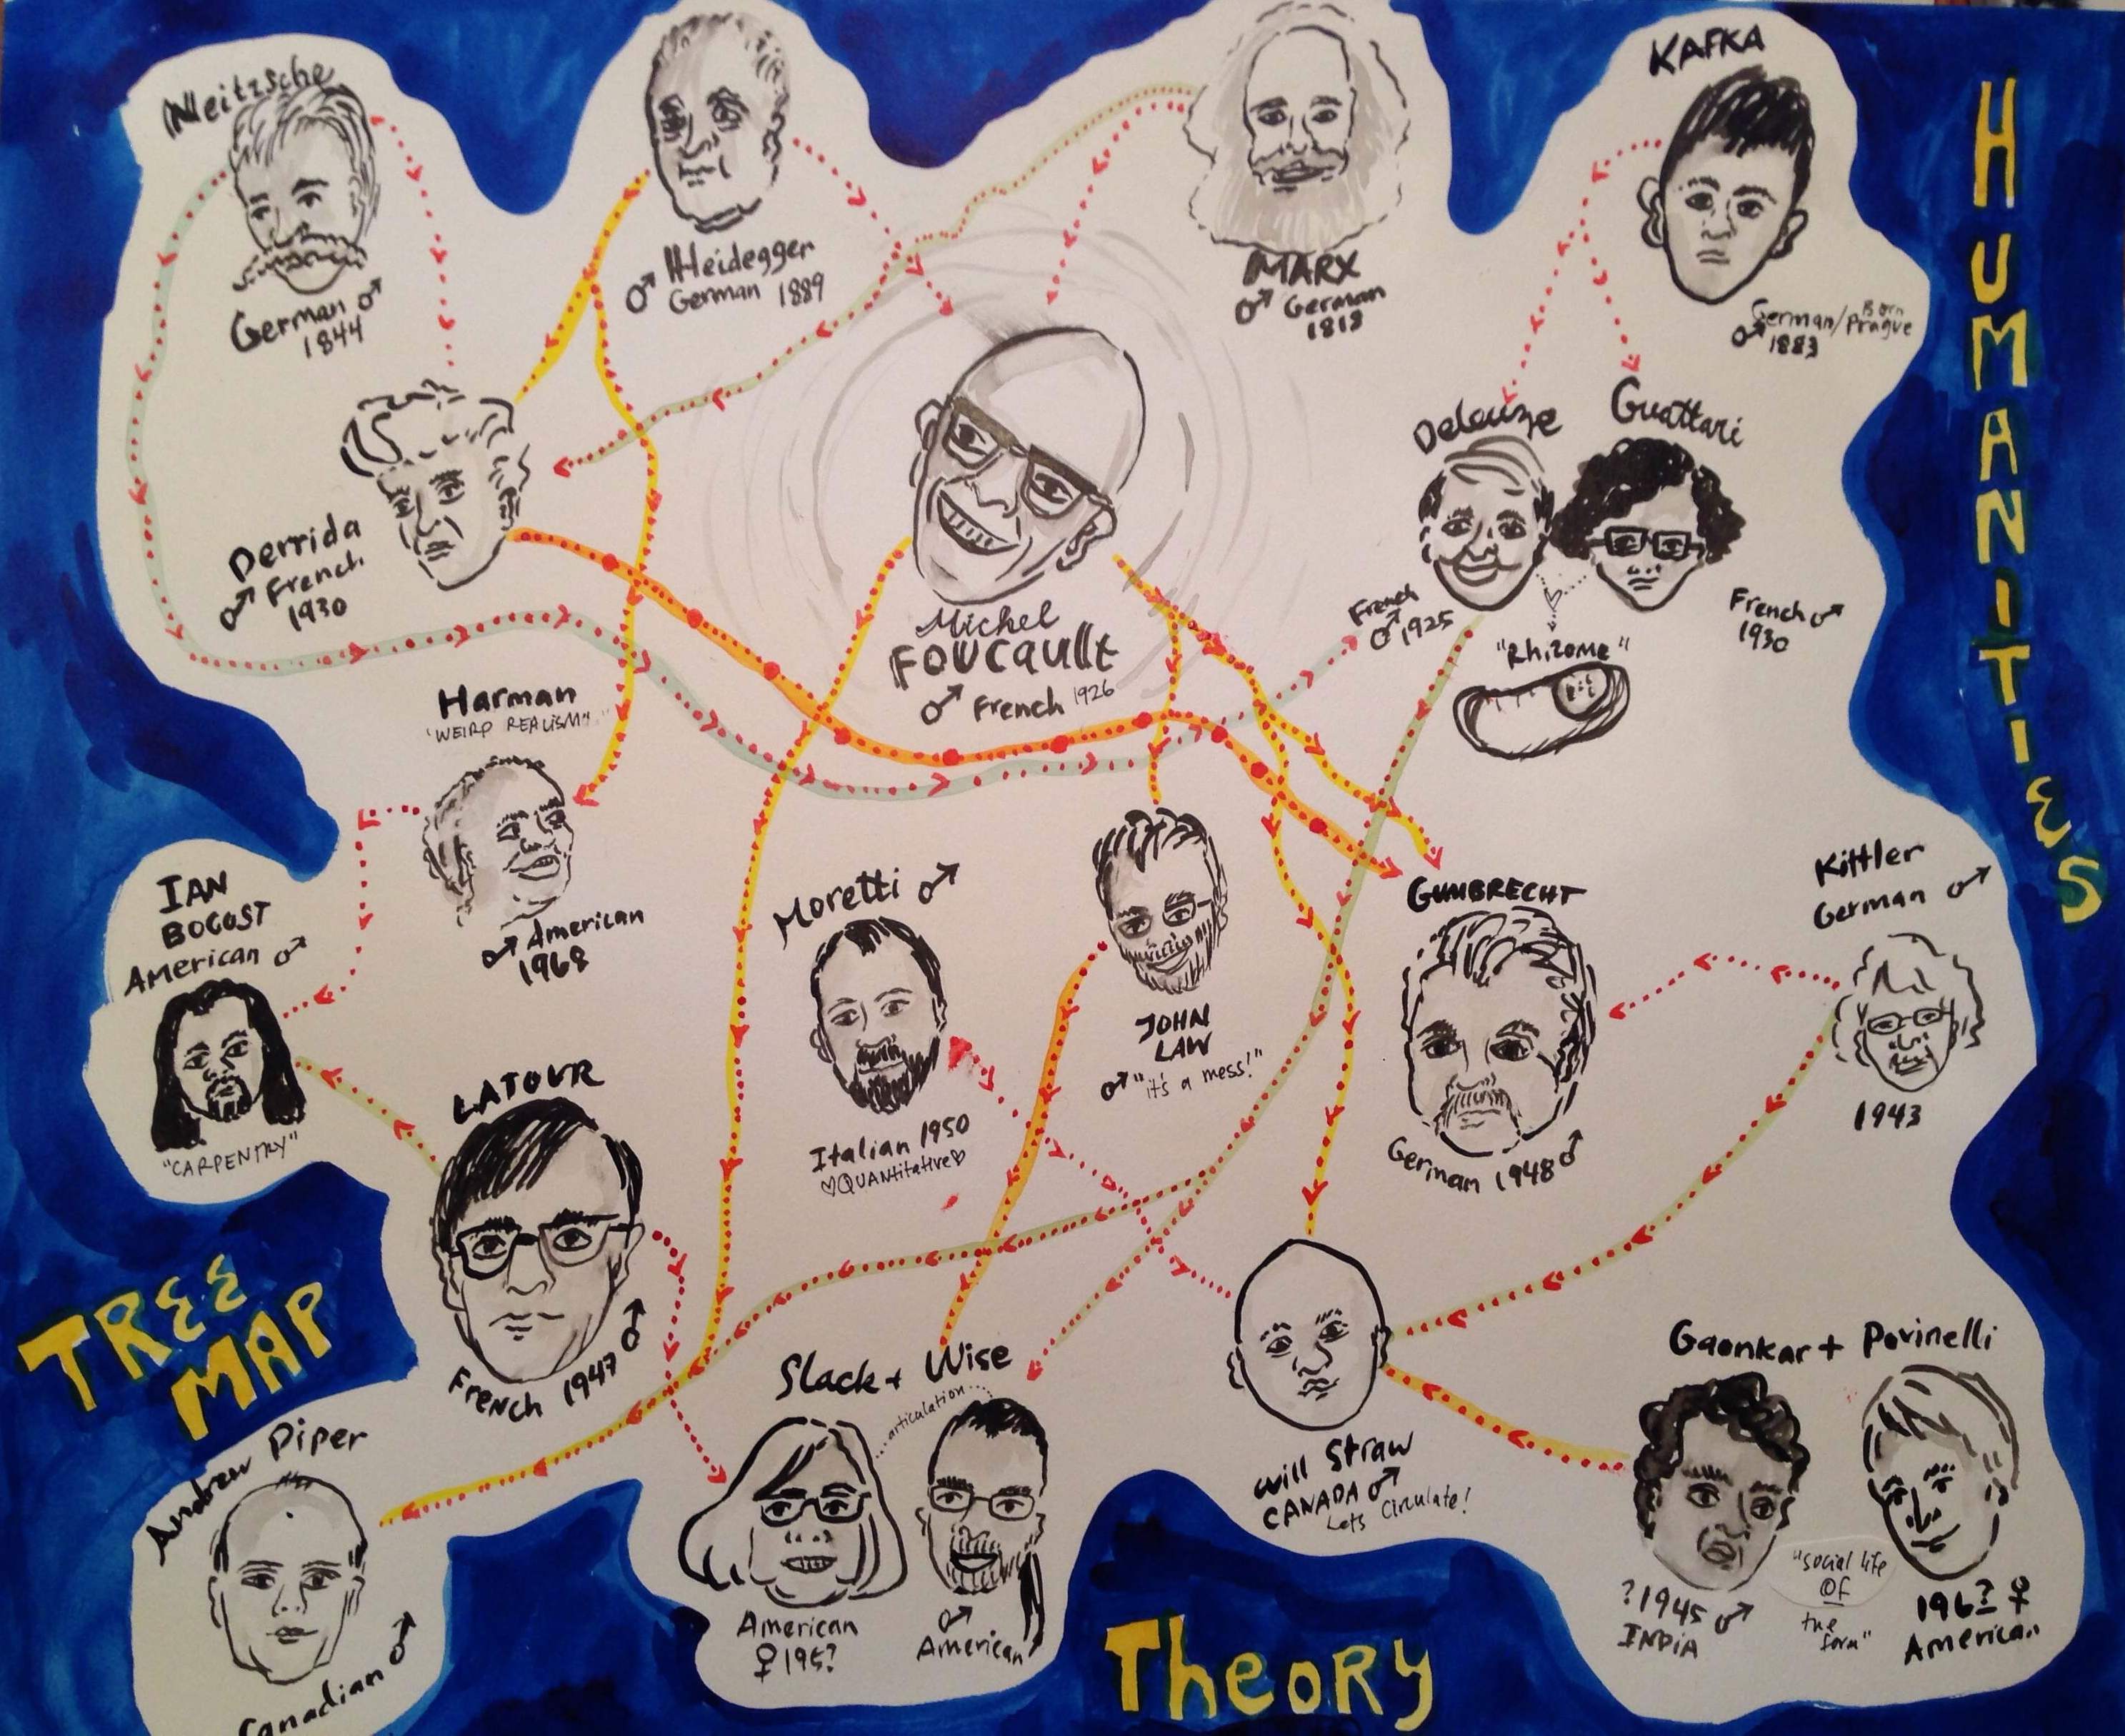
My initial plotting of the theorist tree:
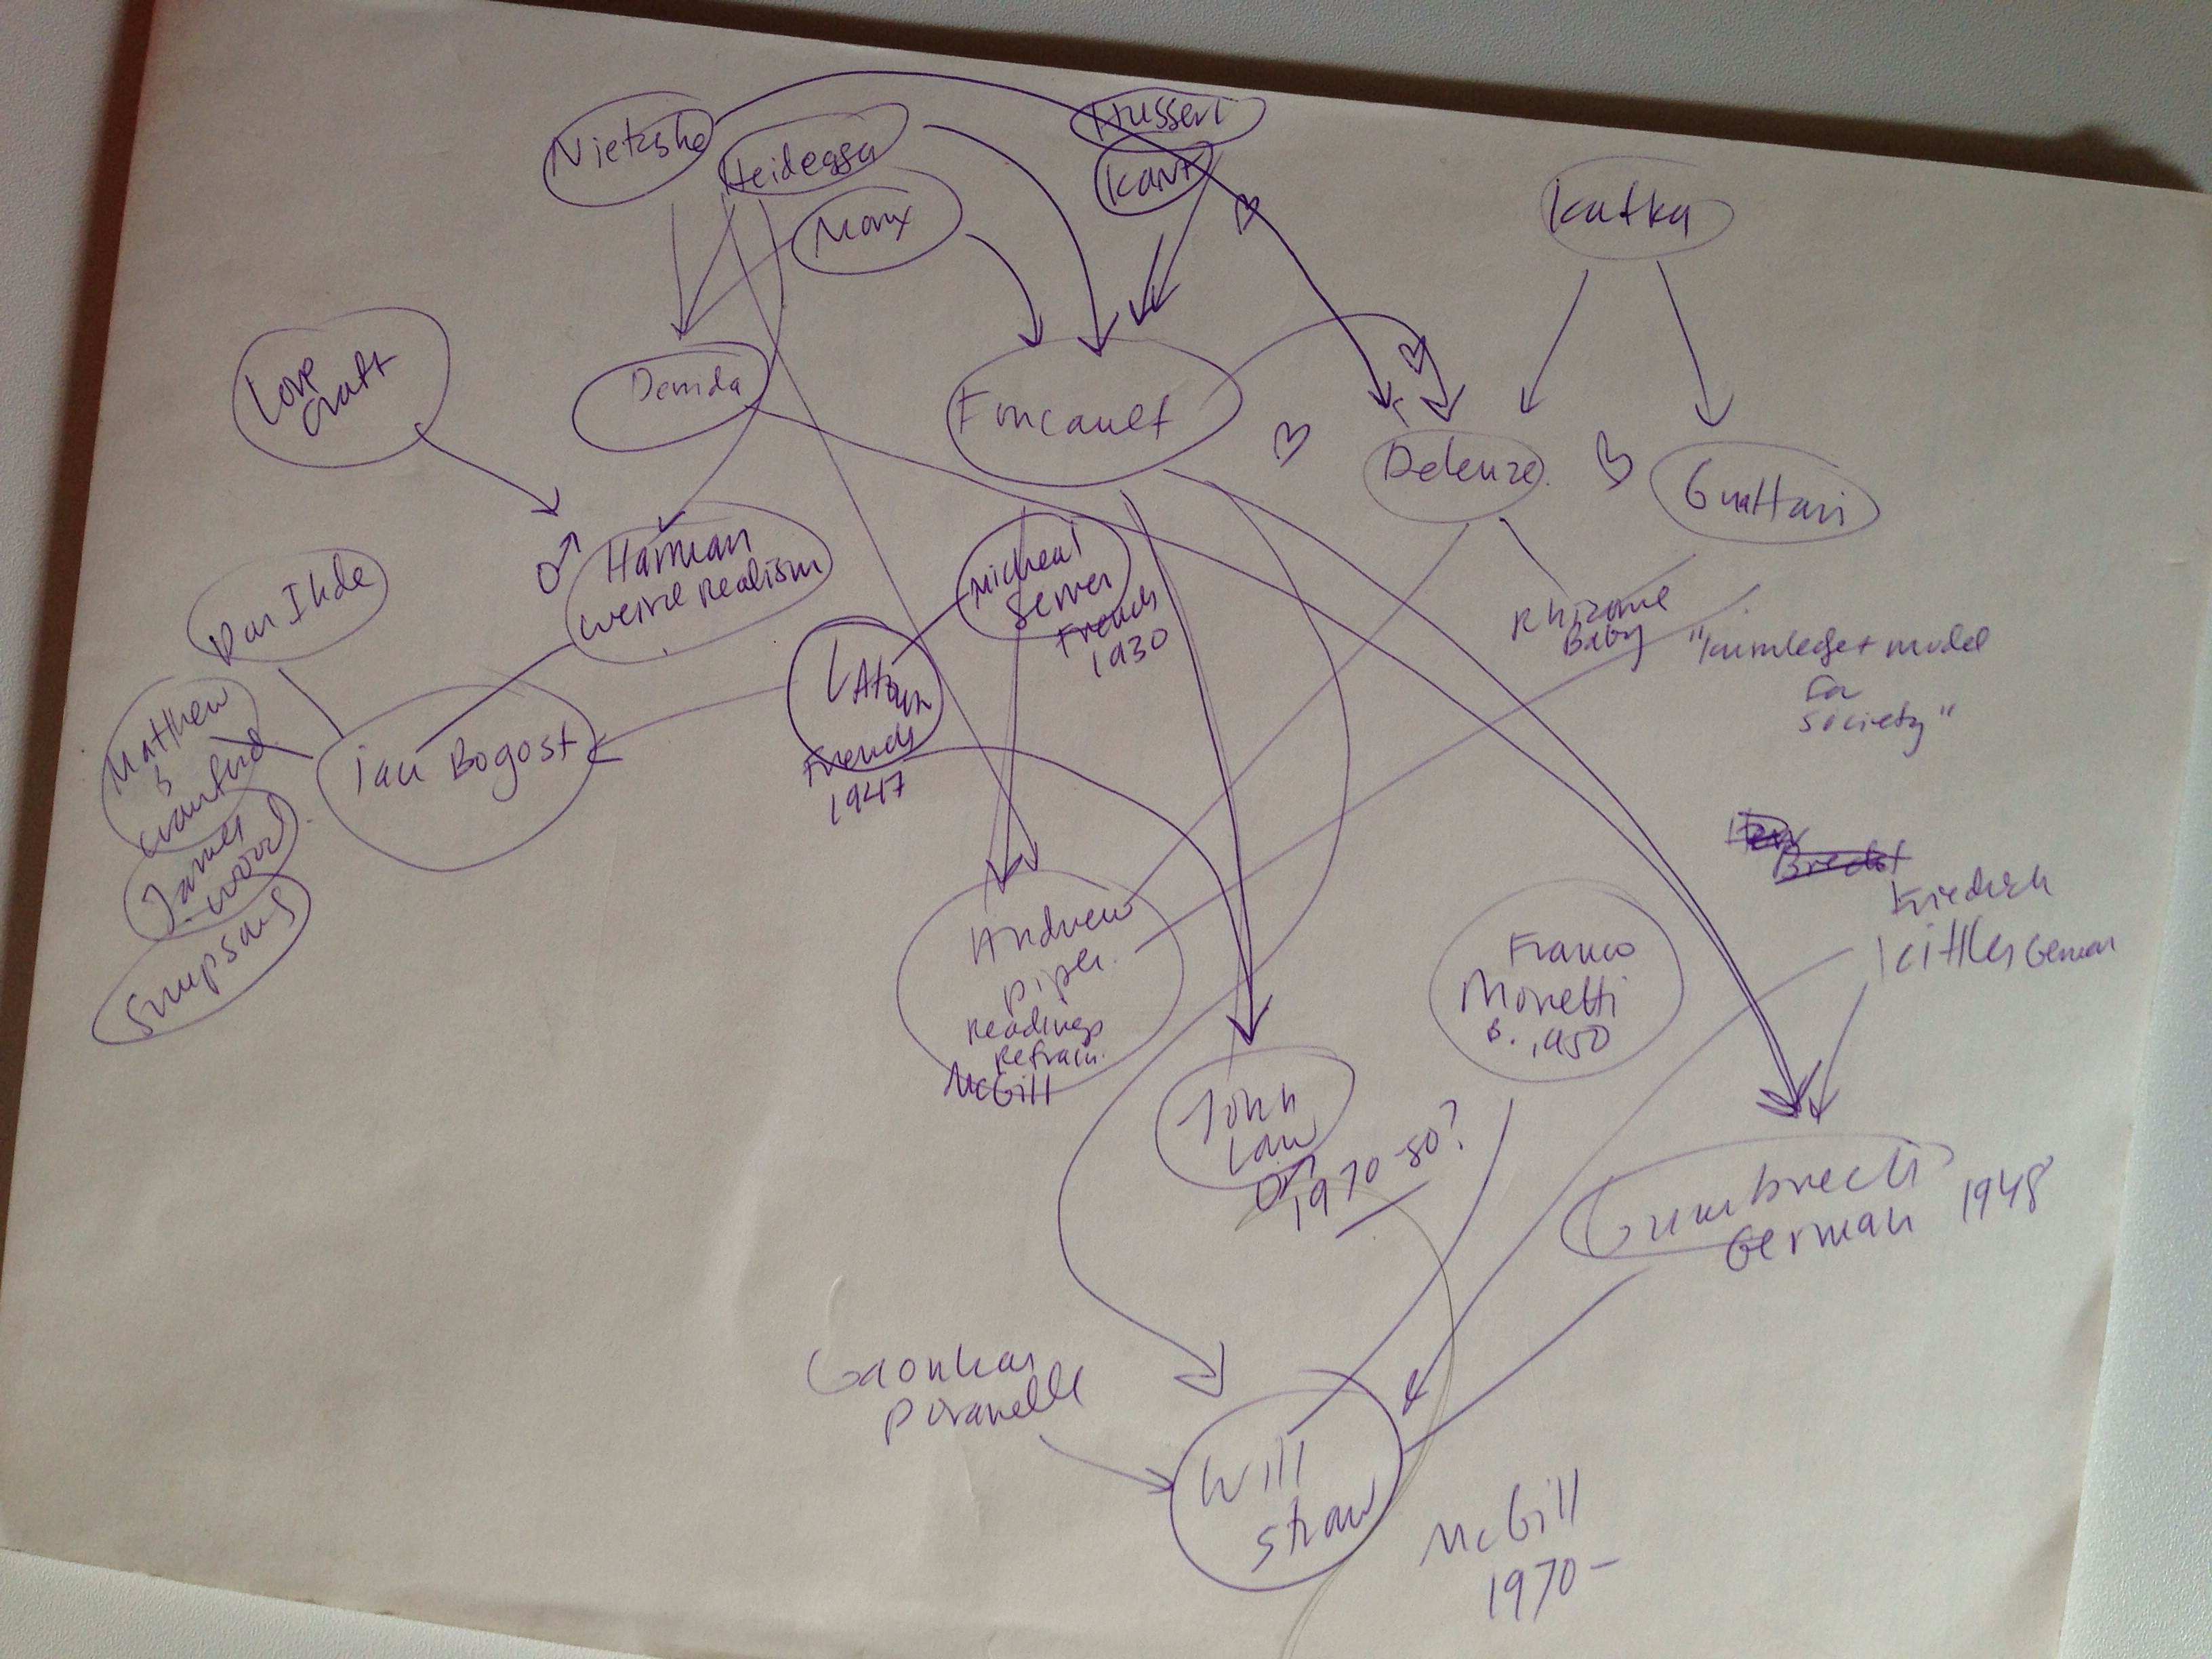
Although it looks like a network graph, it’s really a tree: I loosely placed them from oldest (top of the page) to youngest (bottom of page). And even though it’s messy – it actually does help me see things:
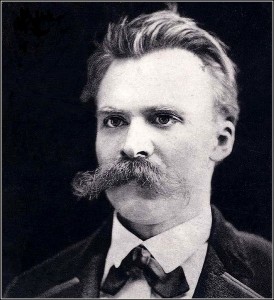
- If you want to be a theorist in the Humanities, you should probably grow a mustache.
- Foucault is by far the most referenced writer in our readings.
- There are other prominent authors that reference within the Humanities less but are referenced more (Moretti, Latour). Does this speak to writing style or more independent or interdisciplinary thought?
- If you do this long enough and are awesome at it, you will come to be referenced by last name only. Also, if you are in collaborative pair.
- Weirdly, there is little symbiotic sharing of intellectual love (other than the collaborative pairs). Most of this seems to simply be because of generational spans.
- At first glance, I thought: of course, it’s all a bunch of white guys from Germany and France. But if you look more closely at the ‘generations’ from top to bottom, you can see that even just in the last 50 years, the field has become much more diverse. I’m not sure if this speaks to the field at large or if Darren has just done a good job of making a point to include these scholars.
To place myself within the spaghetti dinner of thought, I’d probably plop myself down right below Moretti, John Law and Slack and Wise. I feel comfortable there in all directions: Mess, visual representations the present new information to the humanities and Articulations and Assemblages. Interestingly, these scholars are inspired by some of the others that I simply can’t get into – but now, seeing the lineage, feel closer to.
What do you see? Can you see anything at all? Does it help to clarify things or just confuse you? What does humor do to the information? Where are your pathways?
*Making Foucault look like the evil mastermind in the middle was a bit of an accident. Or was it?
And, just for fun, the winning mustache goes to: Nietzsche.
The winning overall hairstyle: Marx.

References:
Goodwin, Jonathan, and John Holbo. Reading Graphs, maps & trees: responses to Franco Moretti. Anderson, SC: Parlor Press, 2011. Print.
Harley, J. B., and Paul Laxton. The new nature of maps: essays in the history of cartography. Baltimore, Md.: Johns Hopkins University Press, 2001. Print.
Moretti, Franco. Graphs, maps, trees: abstract models for a literary history. London: Verso, 2005. Print.

What a great idea, Annie, to tree-ify our readings. It does clarify things and confirms my own impression that the authors are all somehow connected. And humor helps: it reminds us that all these theorists are also very human beings, with crazy hair, etc…
Regarding your tree graph, I believe that the viewer needs additional explanations, i.e. why the connecting lines were drawn as they appear. Otherwise one might be led to believe that Foucault and Derrida, for instance, are not connected to each other. In other words, the tree can’t stand alone; as you say, you had to simplify a lot.
One question: why did you choose to start at the top and work your way down to the “younger” writers? Metaphorically speaking, doesn’t this mean that your tree will grow more and more roots?
Hi Elizabeth! Great questions.
Good question about the way I graphed the tree and how much more explanation it needs. Because I was working with limited time/page space, I kept the ‘influences’ to just what was in the readings we’ve had. So, anyone we didn’t read, I didn’t map their influences. Again, this does leave a ton out.
And, I love your observation that the tree map could more resemble a roots map. I often wonder about both/either; I think the tree emphasizes the inheritance and the roots emphasize the influence. But, I feel like both are considered tree graphs, just a different focus for what you’re trying to map.
Thanks for your comment!