selfiecity: data visualization, design, narrrative
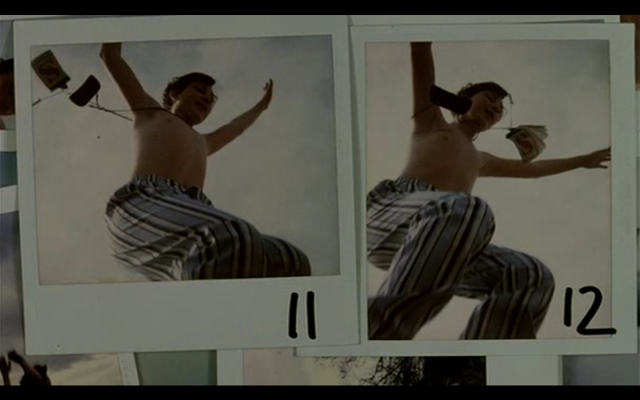
From Peter Greenaway’s Drowning by Numbers
Lev Manovich contrasts database and narrative as opposing cultural forms. Their difference lies partly in their fundamentally different ways of ordering and accessing information. The database stores individual, interchangeable records of information, each of equivalent significance that can be accessed randomly in any order. Narrative demands some form of sequential semantic ordering. A database can be used to emulate narrative, by selecting individual records according to some rules, but the database itself is never truly a narrator, unless you project meaning onto the numerical sequence of record identifiers (like Peter Greenaway).
Manovich argues that the ontology of the computer is projected onto culture itself, and the database, a quintessential tool of computerization, has become a dominant cultural form. Database logic informs the way that we interact with digital information and our expectations of how networked environments work. As the world appears increasingly to us like a database, i.e. as an “endless and unstructured collection of images, texts and other data records” we are increasingly motivated to model it as a database (1).
This text dates originally from 1999. No one really talks about databases any more, unless their object of study is a specific database. Now everyone likes to talk about data. The structured discourse of interoperability that Liu posited as discourse network 2000 renders the database redundant. As long as databases are amenable to the necessary standards, we can now move through data sourced from multiple databases seamlessly. While the underlying ‘container’ logic of the database is still an important functional component of this discourse, it has been superseded in our imaginations by what fills the container, data.
Manovich concludes by arguing that we must learn how to merge database and narrative into a new cultural form (2). I think that this desire to unite these two forms has inspired much of his work in data visualization, and that we are perhaps beginning to see such a new form emerge as people experiment with data as a way of discovering and tracing narratives.
Data and meaning
In 2008 Chris Anderson speculated that big data would mean the end of the scientific method (3). Scientists would analyze data without hypotheses, and make conclusions based on their identification of emergent patterns. Anderson’s idea was roundly rejected by scientists, but culturally it seemed to take hold and to influence the way that many people understand ‘big data’. This conceptual framing of data has a long history, Anderson’s controversial speculations only condensed and made widely visible some of these assumptions about access to ‘raw’ data.
With increased computing power and interest in ‘data-driven’ research and journalism, we see the emergence of a new form of narration that I will refer to as data design. Data design uses data analysis techniques to extract stories, or the beginnings of stories, from sets of data. It is a new and hybrid cultural form that uses patterns in data to reveal some underlying meaning behind a phenomenon. I would like to look at one example of this type of data-narrative hybrid, selfiecity, a project led by Lev Manovich.
selfiecity
The goal of selfiecity is to ask broadly whether a data oriented approach to the phenomenon of the selfie might offer any new or interesting observations. The project randomly selected thousands of photos from Instagram from five different cities in order to compare them visually and assess what meaning (if any) can be derived from the results. The results of the project are presented online as a series of theoretical, analytical, and artistic productions, including interactive visualization tools, theoretical essays, as well as statistics.
The selfiecity website presents its work and findings in narrative form, both through design as we move from top to bottom, and in its description of different phases or components of the project. In this case the narrative is not about finding an answer but in exposing the research process the questions that arise along the way. There are many layers of representation and interpretation to be considered within this hybrid cultural form of data design, some of which I will discuss in reference to this project.
Collecting Data
In the digital environment, data is often taken for granted as a factual raw material, a resource to be mined and processed to produce useful information. But data is never simply inert material to be converted into useful information. It embodies culturally specific principles of organization and knowledge representation. Using data as a starting point “…often leads to an unnoticed assumption that data are transparent, that information is self-evident, the fundamental stuff of truth itself.” (4)
Data is generated by people. However abstract it may appear, at some point a person made decisions about what information to store about a particular object and the set of fields needed in order to represent it accurately. These decisions are always based on other norms related to ideas about managing knowledge and information. For example, bibliographic data conforms to a set of historical standards that have become almost invisible, yet reflect culturally specific ideas about authorship and publishing. These data structures and the assumptions underlying them only become visible when they fail miserably to represent objects that do not ‘fit’ their container.
The form in which we receive data always says something about who created it and for what reason. To work with a data source requires an understanding of its specific set of assumptions, characteristics and limitations. In the case of selfiecity, the data source is Instagram, a mobile photo-sharing application. There are obviously many lines of inquiry that could be considered regarding social media and the phenomenon of selfies when using such a data source. Also, it is important to account for the types of information that can be harvested from each image, metadata that are defined in part by the requirements of interoperability and in part by the affordances of the platform.
Processing Data
Working with image files as a data source brings with it interesting interpretive challenges. Images cannot be automatically analyzed – computer algorithms are getting better at visual image processing but are not yet reliable enough for this type of research. As a result, much of this kind of research relies on a combination of machine and human labour. This is an area of uncomfortable tension in much digital humanities work. How much can be automated? In most cases it is still necessary for people to perform interpretative acts to validate the work of machines, and this labour is often outsourced.

Chess automaton “Ajeeb the Wonderful”. http://publicdomainreview.org/collections/cabinet-card-photographs-from-the-harvard-theatre-collection
In selfiecity, human labour was necessary to make interpretive judgements about characteristics of the images and of the people depicted. In order to produce a data set of sufficient size and quality, this work has to be broken down into modular tasks and outsourced. This work was performed by workers from Amazon’s Mechanical Turk (5). In the AMT, these tasks are labelled as ‘HITs’ – human intelligence tasks, and workers are paid a few cents per task. Without such a source of cheap, modular labour many digital humanities and social science projects could not happen. Besides the ethical questions associated with this kind of labour, the work produced through the AMT adds another layer of interpretation to the data, based on the cultural and social conditions of these ‘invisible’ workers.
From data to narrative?
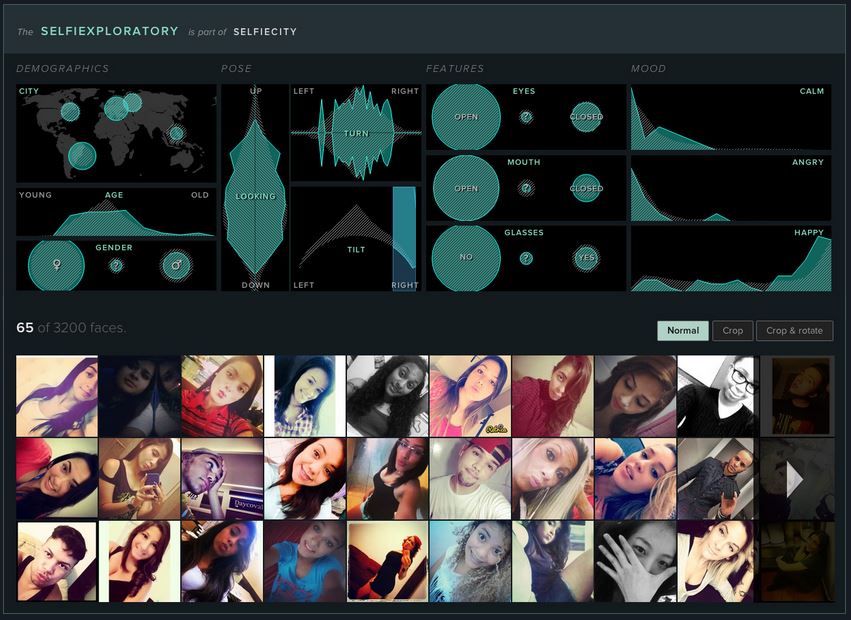
Once the data has been collected and processed, what’s next? For selfiecity, the next decision was what attributes of the collected photos to analyze and compare? In addition to the city, they chose criteria such as gender, age, head tilt, eyes open or closed, facial expression. What kind of narrative does this use of data support? What I like about this project is that they have provided some different avenues of meaning-making. They present their findings in statistical and visual form without providing any conclusions. There is an interface (selfiexploratory) for browsing the collected images based on different criteria. There are also theoretical contributions on selfies and on selfiecity. Some interesting reflections on this project come from the blog of Mortiz Stefaner, responsible for selfiecity creative direction and data visualization. There are a couple of quotes from him that I think are relevant to the understanding of data design, and that directly address some of the interpretive complications at work in this project.
“…all of our findings have to be taken with a grain of salt: for instance, on our selfies, Bangkok women seem to be the youngest. This could have many reasons: maybe, more younger people use mobiles in Bangkok? Maybe, the average Mechanical Turk worker misjudges women from Bangkok to look younger? Maybe, it is just that Instagram is more popular for young people in Bangkok, while the older ones post a lot of selfies on other platforms?” (6)
“…any serious visualization of a sufficiently complex topic should always aim at exposing the complexity, the inner contradictions, the manifold nature of the underlying phenomenon. I like to provide users with a structured way to explore a complex phenomenon on their own terms, in a sensually rich mosaic of media and facts rather than a pre-digested narrative with a surprise at the end. To me, interesting topics rarely boil down to a single story.” (7)
I see this project as a case study that shows how such a hybrid form of data and narrative might work, and that takes into account many of the problematic issues that underlie the use of data as a material for generating meaning. Even when patterns can be found in the data, are they meaningful? Or are they products of the intellectual labour that was required to collect and process the data? Are they a product of the sociotechnical conventions of the platform that hosts the data, Instagram? How do the cultural differences between people in these five cities impact their self-portrayals on this platform? Perhaps what we can take from this case is that there are narratives both before and after the data, and there is never just one story to tell.
Works Cited
1. Manovich, Lev. “Database As Symbolic Form.” Database Aesthetics: Art in the Age of Information Overflow. Ed. Victoria Vesna. Minneapolis: University of Minnesota Press, 2007. p. 40.
2. Ibid., p. 58.
3. Anderson, Chris. “The End of Theory: The Data Deluge Makes the Scientific Method Obsolete.” Wired Magazine 16.07. July 2008. < http://archive.wired.com/science/discoveries/magazine/16-07/pb_theory >
4. Gitelman, Lisa and Virginia Jackson. “Introduction.” “Raw Data” is an Oxymoron. Cambridge, MA: MIT Press, 2013. p. 2.
5. Amazon Mechanical Turk. < https://www.mturk.com/mturk/welcome >
6. Stefaner, Moritz. “selfiecity.” Well-formed data. February 22, 2014. < http://well-formed-data.net/archives/996/selfiecity >
7. Stefaner, Moritz. “Worlds, not stories.” Well-formed data. March 2, 2014. < http://well-formed-data.net/archives/1027/worlds-not-stories >
