The post Bootcamp – The History of Physics appeared first on &.
]]>
All time favourite comic. Also an interesting commentary on how “Physics” as genre is conveyed.
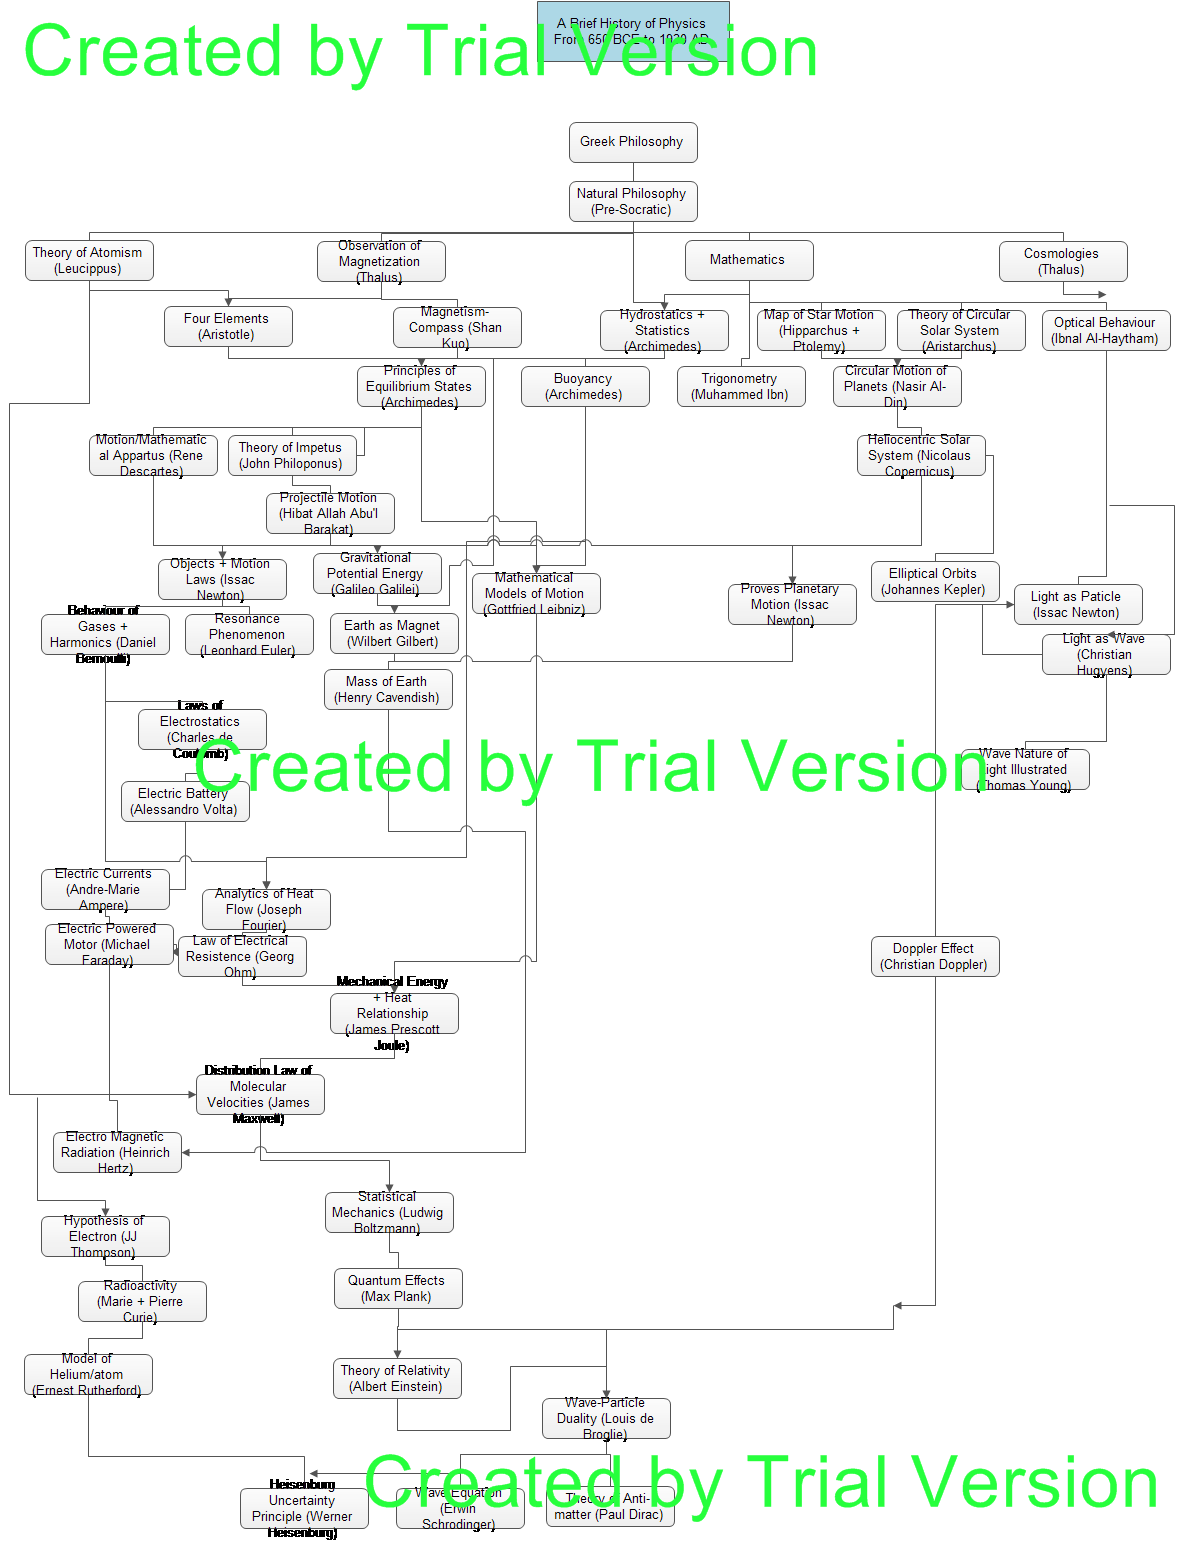
The initial impetus was to ‘tree’ the history of Physics but it soon morphed into an analysis of editorial practices and an evaluation of historical importance. To include all scientific discoveries in the field of physics as well as the implicit connections is far too vast a project therefore I engaged only with what is most commonly accepted as valued discoveries/theories. But what is value in the context of a tree? How can we assess the usefulness of a tree and the information it displays?
History of Physics PDF (a better version)
One of the inevitable failures of this experiment was consolidating and ranking information, something which is addressed (more subliminally than formally) in Franco Moretti’s Graphs, Maps, Trees. In reference to his detective novel project, the further Moretti examined the archive, the more complex “became the genre’s morphospace” (50); the same could be observed within the history of Physics. Hyperlinks on Physics’ Wikipedia pages lead to more detailed accounts and developments of theories, textbooks include sources from other publications that provide a more comprehensive archive of achievements. Trees articulate difference (Moretti 52), as well as articulating the editorial presence, the authority through which the information is filtered and possibly sourced. Trees articulate space.
“Divergence prepares the ground for convergence” (Moretti 55), a statement applicable to the history of Physics. Theories in Physics diverge into four branches early in history, however by the twentieth century they begin to intermingle, leading to a more complex model of the universe. It is the motivations and context for these convergences/divergences which provide a commentary on social forms. Does Physics follow this pattern because publication is more easily disseminated due to increases in printing capacities? Or because transportation between academic sites is more accessible? Or because after hundreds of years new ideas are harder to invent? The tree does represent possible answers yet due to the editorial constraints of tree imposed by time, computer screen size, digital programs and other factors it also does not confirm the validity of arguments. By excluding information as is required by the visualization process of a tree, it cannot fully be contextualized. What is excluded becomes a determining factor in assessing the efficacy of the tree. In this tree statements about increasing globalization, movement of ideas, notions of scholarship, capitalism, technological development, social recognition of “sciences,” and decreases in religious authority all contribute to the evolution of theories and theorists but are not completely visualized.
Contextualization then is extracted from the tree’s evolution; when examining a linguistic tree Moretti explains that it “is a way of sketching how far a certain language has moved from another one, or from their common point of origin” (46). But isn’t origin something we, as a class, have been eschewing? Foucauldian theory focuses on the statements, which Moretti does to some extent, but the tree as a model implicitly argues for an origin, for a transcendental signifier in order to calibrate our own position. I couldn’t point to an exact moment, an exact philosopher who began classical Physics, even textbooks claim dissimilar sources, therefore I began with a generalized movement. This decision also aligned with my desire to subvert a singular narrative, to represent the multiplicity of origin, i.e. closer to Foucault’s discursive statements and farther from a lineated approach. Origin is also reinforced through tree softwareI used several applications: Edraw Max, yEd graph Editor, TreeForm Syntax and Microsoft Word’s tree function. All of these use templates with an origin point, there was only one program that permitted multiple origin points. Therefore software influences certain modes of approaching problems and perhaps reiterates Western notions of thought.
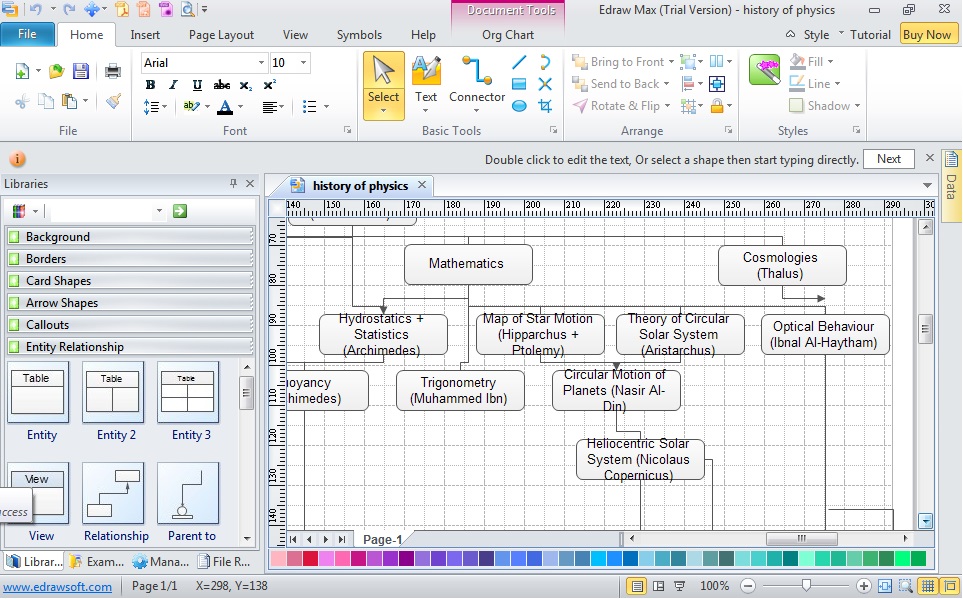
A screenshot of the tree software.
Furthermore its constraining nature is recognized in my inability to rid the “trial version” print that appears over top of my trees. The software that was easiest and best suited to my tree was not free restricting audience and authorial presence.
Moretti adapts “tree” methodology for visualizing “the interplay between history and form” (43); the history of Physics tree attempts a similar feat, however it does not focus on form as much as perpetuation of thought. In the tree the lines of connection demonstrate one of two things: a direct reference in the scholarly papers between theories, or an irrefutable claim between the two, i.e. a causal relationship. Trees, in historical displays, illustrate causality, an evolution rather than a connection, there is no two way movement, the direction is singular. I wonder if this is really the way Physics developed or if has a more circular/oscillating form which our Western traditions deny visualizations of.
————————————————————————————
Works Cited
Giancoli, Douglas. Physics for Scientists and Engineers 3rd Edition. New Jersey: Prentice Hall Publishing, 2000. Print.
Milhorn, Howard. The History of Physics. USA: Virtualbookworm.com Publishing, 2008. Print.
Moretti, Franco. “GRAPHS, MAPS, TREES: Abstract Models for Literary History – 3.” New Left Review 28 (Jul-Aug 2004): 43-63. Print.
“The History of Physics.” Wikipedia. Wikipedia, 2 Nov. 2013. Web. 4 Nov. 2013.
The post Bootcamp – The History of Physics appeared first on &.
]]>The post Getting Graphic: Representing Representations in Humanities and Sciences appeared first on &.
]]>Preview:

Source: Randall Munroe, XKCD
INTRODUCTION: GOOGLING GRAPHS
A Google search for the prompt “graphs are…” yields the following results: the best way to summarize data, visual representations of what, everywhere, often constructed from tables of information, and what of relationships. These fragmentary results illustrate the various approaches to graphs by different fields of research and institutional practices, as well as common conceptions regarding their purpose and value. In the article “Graphs, Maps, Trees,” Franco Moretti argues for a quantitative approach to illustrating literary trends; a shift from hermeneutic practices around individual texts to a quantitative analysis of literature (67). Introducing graphic displays of literary information exposes the field of literary studies to the questions aforementioned, not only is the question what the display shows but how and why its modality functions and what are the implications regarding power relations. What are the politics of graphing and how do they relate to the respective fields of humanities and sciences? Why does quantitative analysis in literature warrant such a “revolutionary” sentiment?
LITERARY LIKENESS: GRAPHS IN HUMANITIES
In “Graphs, Maps, Trees” Moretti employs a combination of line and bar graphs to illustrate his empirical analysis of the rise and fall of the novel. “Figure 1: The rise of the novel, 18th to 20th century” depicts increases in literary production in Britain, Japan, Italy, Spain, and Nigeria over 300 years with specific clustering effects (Moretti 69).

Fig. 1 Source: Franco Moretti, “Graphs, Maps, Trees”
Moretti introduces the scholars whose data will provide the basis for the graph at the start of the section two, several lines before referencing Figure 1 in text and a page before the actual illustration (68-69). The contextualization then appears before the reader encounters the graph, and is repeated in the figure caption which also lists the sources, as is captured by Figure 1 above. This reiteration of source material provides an emphasis on validity and traditional scholarly methods, that by referencing accepted scholarly work the author’s own hypothesis or statement is by connection authorized as well. Joseph Bensman discusses the elitism of footnotes whereby one must cite another scholar who is “equal or higher in prestige” in order to gain legitimacy (450), the data sources for Moretti’s graph work similarly. The graph and its data sources connote power relations precluding contradictions and complexities of authorship and authority, as power exerts its forces in humanities research through the figure of the Author-god. Bensman states that “footnotes have important institutional, “political” and aesthetic functions” (443); similarly these functions are also influenced by and through the graphs presented. The aesthetics as well as the political functions assert the graph’s authoritative dominance, Moretti uses a quote from lauded scholar Roland Barthes to champion the removal of the subjective from his analysis and thus this quote corroborates the quantitative analysis methodology (69).
BATTLEDOME: SCIENCE VS. ARTS
Moretti states that “graphs are not models; they are not simplified versions of a theoretical structure in the way maps and (especially) evolutionary trees” are (72): graphs are relations. Moretti both supports and contradicts this thesis with his own graphs; although they do illustrate relations between the numbers of books produced and the books’ locations, the accuracy as well as the reliance on traditional scholarly validation subverts the radical claims. Cosma Shalizi criticizes Moretti’s methods, arguing that Moretti should have analysed the data himself and mathematically calculated the probabilities for clustering occurrences and errors (118). This argument represents the burgeoning issue of transplanting quantitative analysis methods from science based research to literary practices. If Moretti’s data sources are proven wrong, or if his methods are found faulty then his argument for literary quantitative analysis can be refuted. An example of traditional scientific graphs is found in Figure 2, taken from a scholarly paper on Higgs modelling, a scientific phenomena which, as the paper attempts to prove, can be adequately imagined through specific microscopic structures called crystal lattices (Siringo 5880).

Fig. 2 Source: Fabio Siringo and Luca Marotta “Nonperturbative Effective Model…”
Regardless of its scientific meaning, the graph connotes several key statements which illustrate the shortcomings and successes of Moretti’s quantitative analysis. The line graph uses the caption to describe the phenomena and its graphic representation, it does not refer to outside sources for validity of previous results. Secondly, error is factored into the illustration by the size of the data points as well as the predicted function (the dashed line). By encrypting the graph with secondary information that is accessible through the primary study, the scientific graph elucidates the conceptualization process, turning to transparency for validation and allowing the reader to deduce its value rather than relying purely on precedent research.
Yet the scientific graph reinforces power relations by assuming the reader is adhering to the conventions of reading graphs, for example understanding that larger data points mean more possible error. Audience influences the output, the graph and caption describe sets of social relations and systems, discursive sets in a Foucaultian sense. In Andrew Piper’s article “Reading’s Refrain: From Bibliography to Topology” he suggests literary topology, which analyses the text not through hermeneutics but by assigning values to the lexicographic elements and represents them visually, signals an inspection of places in which literature intersects with other types of social strata and discursive readings (394). The inability to escape power relations through graphs, both in the humanities and sciences, highlights the connection between the process of academic research, Authorship (as in the panoptic) and social rules. Moretti hypothesizes that “quantification poses the problem… and form offers the solution” (86) which can be compared to concept of literary topology. Literary topology, as Piper illustrates in the Goethe graph, performs a similar function to work of Moretti’s graph, preferring quantitative data to the interpretative techniques (385), exhibiting shifting power relations between Author and reader that allow the reader more authority. This also is present in the scientific article, as form is contextualized later in the Higgs paper, when the discussion reveals the equation for the line graph and its derivation, evoking specific associations to fields of study and popularized theories. Therefore the graph summarizes the data while reflecting the environment in which it was constructed, physically from the digital program which produces the equation to the politics of theory behind the illustration.
HYBRIDIZATION STATION
Moretti’s graph attempts to convey more than one set of data results, i.e. more than one line segment. The results represent a comparison between countries and publication numbers, yet temporally they do not provide a cohesive linearity and further inference on the part of the reader is required. The article “Fingerprint Matrices: Uncovering the dynamics of social networks in prose literature” examines inter-character relations and compares these relations between novels, such as The Queen’s Tiara by Carl Jonas Love Almquist and J.K. Rowling’s Harry Potter and the Philospher’s Stone. Although the articles’ subject matter is slightly different, both propagate quantitative analysis of relations as the main analytic form; the graphs included illustrate the shift in methodologies and as such Piper’s concept that topology is the analysis of ratio rather than difference (379).

Fig. 3 Source: D. Oelke, D. Kokkinakis, and D. A. Keim, “Fingerprint Matrices”
“Fingerprint Matrices” presents material in a radically different graphic form than in the Moretti article, it uses matrix graphs to visual social networks. Ratio is “knowledge of the relational and the scalar, the co-presence of difference” (Piper 382); this is witnessed in the Harry Potter matrix graph which highlights the relationships between characters as well as their placement within the novel and subsequently their importance in the plot. With multiple goals the graphing structures must change as the two dimensional line graph used by Moretti is no longer able to display the information, and thus fingerprint matrices (as seen in Figure 3) are created instead (Oelke 372), becoming visualizations of text.
Alongside the fingerprint matrices are the researcher’s methodologies and background sections. The latter section (which cites Moretti) again displays the typical academic posturing, however it is more concise than previous essays examined. The methodologies section describes data collection, processing and graphic output, something which is markedly absent from Moretti’s section two-Figure 1 relationship. Piper states “when we read topologically we are reading our way through language’s historical entanglements,” (Piper 378) therefore the fingerprint matrices not only examine the repetition of Harry Potter characters, but the changes in research illustrations and performs a conjoining of theory and criticism (Piper 389). By producing a methodology whereby all its mechanisms become pellucid the validity of traditional research in humanities changes. No longer do the citations hold substantial authoritative power, but the empirical data and its representations are available for the reader to evaluate the efficacy of the results. Therefore the modifications of the mechanism and its display alter the researcher’s writing as well as the traditional outline of literary articles, which now use methodology and discussion section headings.
Conversely, the opposite argument can be made, that the articles modify the methods; these texts are located in digital domains. All three graphs outputs are digitally rendered, the scientific graph and fingerprint matrices both disclose the graphing procedures which use programs to sift and organize data. By analyzing the pixilation of the lines and the familiar settings of LaTEX, Moretti’s graphappe ars to be constructed via computer program. Digital graphs now require the reader to examine new elements, such as the efficiency of graphing programs or the image resolution in order to discern veracity and value. A further discursive set creates the authoritative relations between journals and readers, another power relation that highlights the function of graphs in scholarship. Currently these articles are available online through Science Direct and the Arts and Humanities Databases, which limits use to university affiliations yet still disseminates the material to a larger audience than through paper production. As quantitative analysis opens more possible readings to literature, the ‘entanglements’ of objects grow; the graphs emphasize the rules of literary production and character relations, rather than the meaning and the objects themselves, reflecting the increased multiplicity of articles and journals available. This perhaps addresses Piper’s question “what does it mean to read electronically?” (373); digital reading utilizes electronic resources and thus makes conscious our academic practices of reading in humanities research. Ultimately more questions remain, those still left unanswered include: how do these academic objects move through popular culture? Where are the intersections between fields of research in regards to graphing techniques? Does digital production of methods alter the function of research?
Works Cited
Bensman, Joseph. “The Aesthetics and Politics of Footnoting.” International Journal of Culture, Politics, and Society 1.3 (1988): 443-470. Web.
Munroe, Randall. “Tall Infographics.” XKCD.com. October 4, 2013. Web. October 19, 2013.
Moretti, Franco. “Graphs, Maps, Trees.” New Left Review 24 (Nov-Dec 2003): 67-913 Web.
Oelke, D., D. Kokkinakis and D.A. Keim. “Fingerprint Matrices: Uncovering the dynamics of social networks in prose literature.” Eurographics Conference on Visualization 32.3. Ed. B. Preim, P. Rheingans and H. Theisel. Oxford: Blackwell Publishing, 2013. Web.
Piper, Andrew. “Reading’s Refrain: From Bibliography to Topology.” English Literary History 80 (2013): 373-399. Web.
Shalizi, Cosma. “Graphs, Trees, Materialism, Fishing.” Reading Graphs, Map, Trees: Responses to Franco Moretti. Ed. Jonathan Goodwin and John Holbo. Anderson: Parlor Press, 2011. 115-139. Web.
Siringo, Fabio and Luca Marotta. “Nonperturbative Effective Model for the Higgs Sector of the Standard Model.” International Journal of Modern Physics A 25.32 (2010): 5865-5884. Web.
The post Getting Graphic: Representing Representations in Humanities and Sciences appeared first on &.
]]>The post Thoughts on Locative Media and Net Art appeared first on &.
]]>Locative Media Sites:
.walk http://www.medienkunstnetz.de/works/dot-walk/images/1/
Wifi http://we-make-money-not-art.com/archives/wifi/
Urban Tapestries http://urbantapestries.net/
Nomadic MILK http://nomadicmilk.net/blog/?page_id=2
Thoughts on Locative Media and Net Art in terms of circulation:
Locative media is defined as a response to “decorporealized, screen-based experiences of net art” and usually involves some element of mapping (Tuters and Varnelis 357). An example, .walk, had participants originating from the same location and following different randomly generated paths, like a “peripatetic computer” (Tuters and Varnelis 357) using code as the guide. It is this insistence of circulation, the exchange between forms that precludes the human body from becoming the main subject, the ‘net art’ examines the differences between computer generated maps rather than the bodies shifting physical locations.
The 1999 “Headmap Manifesto” by Ben Russell calls for locative media to deconstruct materiality or rather lack of materiality; to break down borders, concepts and distinctions of material, ranks, figures and usual assumptions allowing the artist and hacker to collapse into the same network of descriptions (357). By introducing projects that open boundaries, such as those that attempt to spread free wifi or disperse bodies, the individual’s relationship with space is modified, as a “second virtual world [is placed] over the physical one” (357). This reinforces Will Straw’s argument that the urban phenomena function as “bases of a ‘behavioural disorientation’ which would produce the city as forever strange” (18). However it must be noted that these artistic endeavors still useful human subjects alongside technology. Is it possible to have locative art without any human subject? Therefore as much as this art engages with estrangement, that is the difference between the stable and the variable, it also relies on engagement in order to cogently orient itself towards the audience.
Importance differences between locative media and ‘net art’ perhaps reveal an answer to this question. Net art is seen as incorporated into mainstream art history and thus passe, whereas locative media embraces its commercialization (358), and possibly points toward an answer: that media which moves toward commercial interacts with other forms of circulation. It is not simply art to be seen by an audience, rather it is picked up by ad agencies or reiterating popular slogans from ads, which function within a different form of circulation.
A second juxtaposition is created between the two kinds of mapping which occur within locative media: “annotative- virtually tagging the world- or phenomenological- tracing the action of the subject in the world” (359), and these two are equated with the Situationist poles of “detournement” and “derive.” The annotative seeks to add or circulate data within the world, with projects such as “Urban Tapestries” through which participants used pdas and phones to map London (359). The derive type art ususally uses a map that perpetuates our awareness of everyday activities like walking (359) and thus become entrenched within a specific form.
Locative media then draws lines between objects and concepts, forms and circulation of forms in that art now functions to mediate these and produce/act to (de)value. This is witnessed in the project MILK which digitally follows milk production, where aside from its Romantic notions, it follows media through data collection, data iteration and rendering and finally compression into visualized form (Tuters and Varnelis 362). Geotagging now includes objects instead of people, realizing Rousseau’s ideas of the genealogy of the object, that we can trace its path (362).
————————————————————————–
Works Cited
Straw, Will. “The Circulatory Turn.” The Wireless Spectrum: The Politics, Practices and Poetics of Mobile Media. Eds. Crow, Longford and Sawchuk. Digital Futures. Toronto: University of Toronto Press, 2009. 17 – 28
Tuters, Marc and Kazys Varnelis. “Beyond Locative Media: Giving Shape to the Internet of Things.” Leonardo 39.4 (2006): 357-363. Web.
The post Thoughts on Locative Media and Net Art appeared first on &.
]]>