The post Labanotation: The Topology of the Moving Body appeared first on &.
]]>“In its diagrammatic nature, topology is a persistent encounter with the shape of language. In moving from the haptic totality of the book to the visual totality of the diagram, topology allows us to reengage with the notion of the textual corpus–as a body in space whose surfaces and contours have meaning. In place of the book’s geometric continuity…topology marks an entry into a textual universe of far greater formal and structural diversity. In returning us to the question of form, topology is also a figurology” (Piper 390).
This quote by Andrew Piper in “Reading’s Refrain: From Bibliography to Topology,” made me think about the text as a three dimensional “body in space” and the varied shapes and “structural diversity” that this concept of the text can illuminate. Both Piper and Franco Moretti take up literature as their object from which to create a topology, but I began to wonder whether this type of diagrammatic approach would be possible with any other type of art. Of course, I always seem to return to dance and performance, and as soon as I began to think about actual bodies in space and the alternative ways they might be recorded or dissected, I remembered the geometrical notation of Laban Movement Analysis.
Rudolf Laban (1879-1958) was a Hungarian dance artist and theorist and a pioneer of modern dance in Europe. He developed Labanotation in 1928 as a means of archival notation and movement analysis, and it is used to this day, even in the development of robotics and human movement simulation. Labanotation uses abstract symbols to define:
Direction and Level of Movement
The static shape is a rectangle, denoting no movement. It is adapted to demonstrate the eight directions: forward, back, side left, side right and the four diagonals. The shading within the shape signifies whether the level of the movement is low, middle or high.

Parts of the Moving Body
The shapes are arranged on a vertical staff to indicate which part of the body is moving. The center line of the staff represents the center line of the body. Symbols situated on the right represent the right side of the body and likewise for the left.
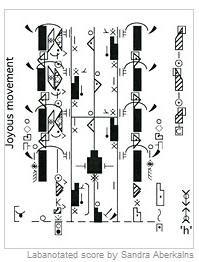
Duration of Movement
The staff is read from bottom to top and the measure is marked by bar lines. The length of the shape/symbol on the staff denotes the duration of the movement. Weight transfer, spatial distance, spatial relations, turns, particular body paths and floor plans are all notated by specific symbols. Jumps are indicated by an absence of symbol, which shows that no part of the body is supported or in contact with the floor.

Dynamics of Movement
Effort symbols are used to indicate an increase or decrease in movement energy. The four categories of quality are:
Space: Direct / Indirect
Weight: Strong / Light
Time: Sudden / Sustained
Flow: Bound / Free


Labanotation not only provided a new way to record movement that would help keep traditional choreography alive and well, but also changed the way we think about dance. Laban successfully liberated dance from the formal constraints of music, narrative, steps and “technique,” focusing instead on the basic shapes and directions of a body in motion.
Laban saw that dance had evolved in a flat space, limited by the space of the theatre and other spaces of performance, and wished to restore depth to dance.
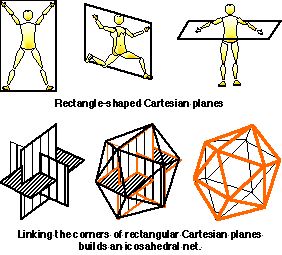
He used the icosahedron to indicate a volume of multiple directions, thus freeing dance from the flatness of the stage.

Laban also separated dance from its entanglement with music–movement for Lacan did not pander to an outside source of melody, rhythm or meter but rather could be sudden or sustained, direct or flexible, light or strong, depending on the impulse from within the dancer’s body. By freeing dance from music, Laban also freed it from time.
In relation to weight, Laban realized that body movements couldn’t be isolated from the flow of weight in the body and that “for every muscular contraction there was a relaxation,” yet by freezing the body at different points in its trajectory, using photography, 3D modeling, drawing or mapping, Laban was able to identify where the subtle shifting of weight began (as an impulse) and receded.
The “Kinesphere” is the Laban Movement Analysis term for the zone of possible movement of a human subject:
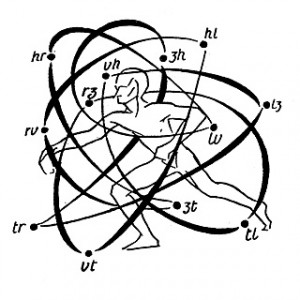
In “Laban’s Choreosophical Model: Movement Visualization Analysis and the Graphic Media Approach to Dance Studies,” Nicolas Salazar Sutil explores the influence Rudolf Laban has had on the way we understand human motion as a collection of fixed points in a movement continuum. Sutil writes “Whilst intuition knows the movement from within as a continuous whole traversing space, an analytical eye encourages us to think of movement and rationalise it as a series of immobile divisions. This breakdown of movement into units” effectively “seizes the continuous flux of movement” (148).
This topological approach is essential to the theoretical study of movement, because when “this meaningless flow becomes identifiable as a fixed object of analysis,” it also becomes “an object for documentation and reconstruction” (148). As Laban puts it, “we consider our snapshots separately only for the sake of analyzing the characteristics of the whole flux” (qtd. in Sutil 148).
Andrew Piper’s conception of textual and literary topology encourages us to consider reading a “deeply visual experience” and to “think about language as a form of action rather than expression” or that “which can be mapped and seen” (387, 377). Likewise, methods of drawing and kinetographic inscription such as Labanotation highlight the activity of dance, rather than its expressionism. Laban’s topography serves the purpose of analytical examination and provides a record of movement that can extract from a random flux of motion a series of basic units within which to construct ordered sequences and patterns (Sutil 148).
Piper writes that “the topology itself is largely metaphorical….Unlike the pages of a book, which can never be observed all at the same time…the topology allows visual access to a textual corpus in its entirety. It replaces the haptic totality of the book with the visual totality of the diagram” (388).
Likewise, whereas individual body positions in dance can never be observed all at once since the body is in constant motion through space, Laban’s notation allows some sense of “visual access to a textual corpus in its entirety” by way of mapping corporeal tendencies in space that span across different bodies, places and temporalities (Piper 388). Laban’s achievement in the formal conceptualization the dancing body is not unlike Franco Moretti’s statement on what graphs and maps can reveal about literature: “Form is precisely the repeatable element of literature: what returns fundamentally unchanged over many cases and many years” (225). These types of approaches are thus shown to reveal, not only the architectural “scaffolding” that lies at the core of a work of literature or a piece of choreography or movement, but also we see how topology can be a useful tool for understanding history, legacy and heritage. Laban’s notation made it possible to record movement on the page, increasing accessibility to choreography and eliminating the human agent who would need to teach said choreography to the dancers of the future. But Laban also changed the way we think about the body in general.
By using the Platonic shape of the icosahedron to demonstrate the capabilities of human movement, Laban invented a somatic mathematization that is both organic and yet also void of the human. Sutil notes this hybridity: “What is remarkably contemporary about Laban’s writings is that they present this relationship between body and ideal space not in a strictly Pythagorean or Platonic sense, that is, not from the point of view of a metaphysical and totally bodiless agency. The Platonic solids are not mathematical objects, they are real-life models of harmonic movement” (161).
There are many similarities between Labanotation and the topological methods that Piper and Moretti offer. These types of methods change how we think about narrative expression, but they also offer a new way of thinking about the text or the object of dissection. Just as Christian Bök’s experiment with Jekyll and Hyde in Already Bad Enough When the Name Is But a Name offers us a new way to visualize the way these characters interact within the text (using a statistical analysis of Stevenson’s use of their names), so too might Labanotation offer a new way to read the narrative of Swan Lake, for example. The difference between the literary and the dance object in these experiments is that whereas literature is produced by a human, once it is on the page, it becomes its own object worthy of analysis. Dance, on the other hand, is inseparable from the human body. The dancer’s body is both canvas and paintbrush, and the production of dance art hinges upon movement as a tactile and experiential sense.
How can the dancer’s agency or subjectivity be accounted for in diagrammatic methods of distant reading such as Laban Movement Analysis? And how does something like Labanotation change the way we think about the body? Is dance even possible without a body, or without multiple limbs or range of motion? These are questions that have arisen and will continue to interest me throughout this exploration.
Works Cited
Moretti, Franco. “The Slaughterhouse of Literature.” MLQ: Modern Language Quarterly 6.1 (March 2000): 207-227.
Piper, Andrew. “Reading’s Refrain: From Bibliography to Topology.” English LIterary History 80 (2013): 373-399.
Sutil, Nicolas Salazar. “Laban’s Choreosophical Model: Movement Visualization Analysis and the Graphic Media Approach to Dance Studies.” Dance Research 30.2 (2013). 147-168.
The post Labanotation: The Topology of the Moving Body appeared first on &.
]]>The post Bootcamp: Our Humanities Theorists Tree-mapped appeared first on &.
]]>Bootcamp + Trees + Nov 7
“There is a constant branching-out, but the branches also grow together again, wholly or partially, all the time.” – Alfred Kroeber, Anthropology
Experiencing our class thus far, I must say it’s been less painful then expected to get my mind inside the theory circle. Once I became familiar with the ‘big names’ and most of the prevalent terms and ideas, everything became much easier. The circulatory nature of theory in the Humanities is evident as you read repeated names and quotes cited in each of our readings. And, as the semester has worn on, it has already become clear to me who speaks loudest to my sensitivities, my ways of working and my intuition. I have favorites: theorists I’ll keep tabs on and those I probably won’t. It’s the same for them. Some drool over Foucault while other go for Delueze and Guattari.
Franco Moretti had me at ‘graphs’.
This last series of Graphs, Maps, Trees is right up my alley because I am an intensely visual learner and communicator. Moretti gave us darn good reasons as to why this use of quantitative data and its visual representation add something to the textual humanities and can give us a new way of seeing. Of Graphs, Maps, Trees, I’m most interested in Trees. It probably has to do with my subject of study and its long lineage or my penchant for trees themselves. The graphs here feel less rigid, more organic and illustrate the more ‘messy’ bits of quantitative data better. Either way, I knew it was the perfect form for my latest question: the lineage of thought.
For this week’s Bootcamp, I’d like to experiment with our own syllabus. Who/what are we reading and what did those people read? How is the flow of theory/knowledge passed down to us and how do we become a part of it? Who inspired those who inspire me?
So, I made a tree graph.
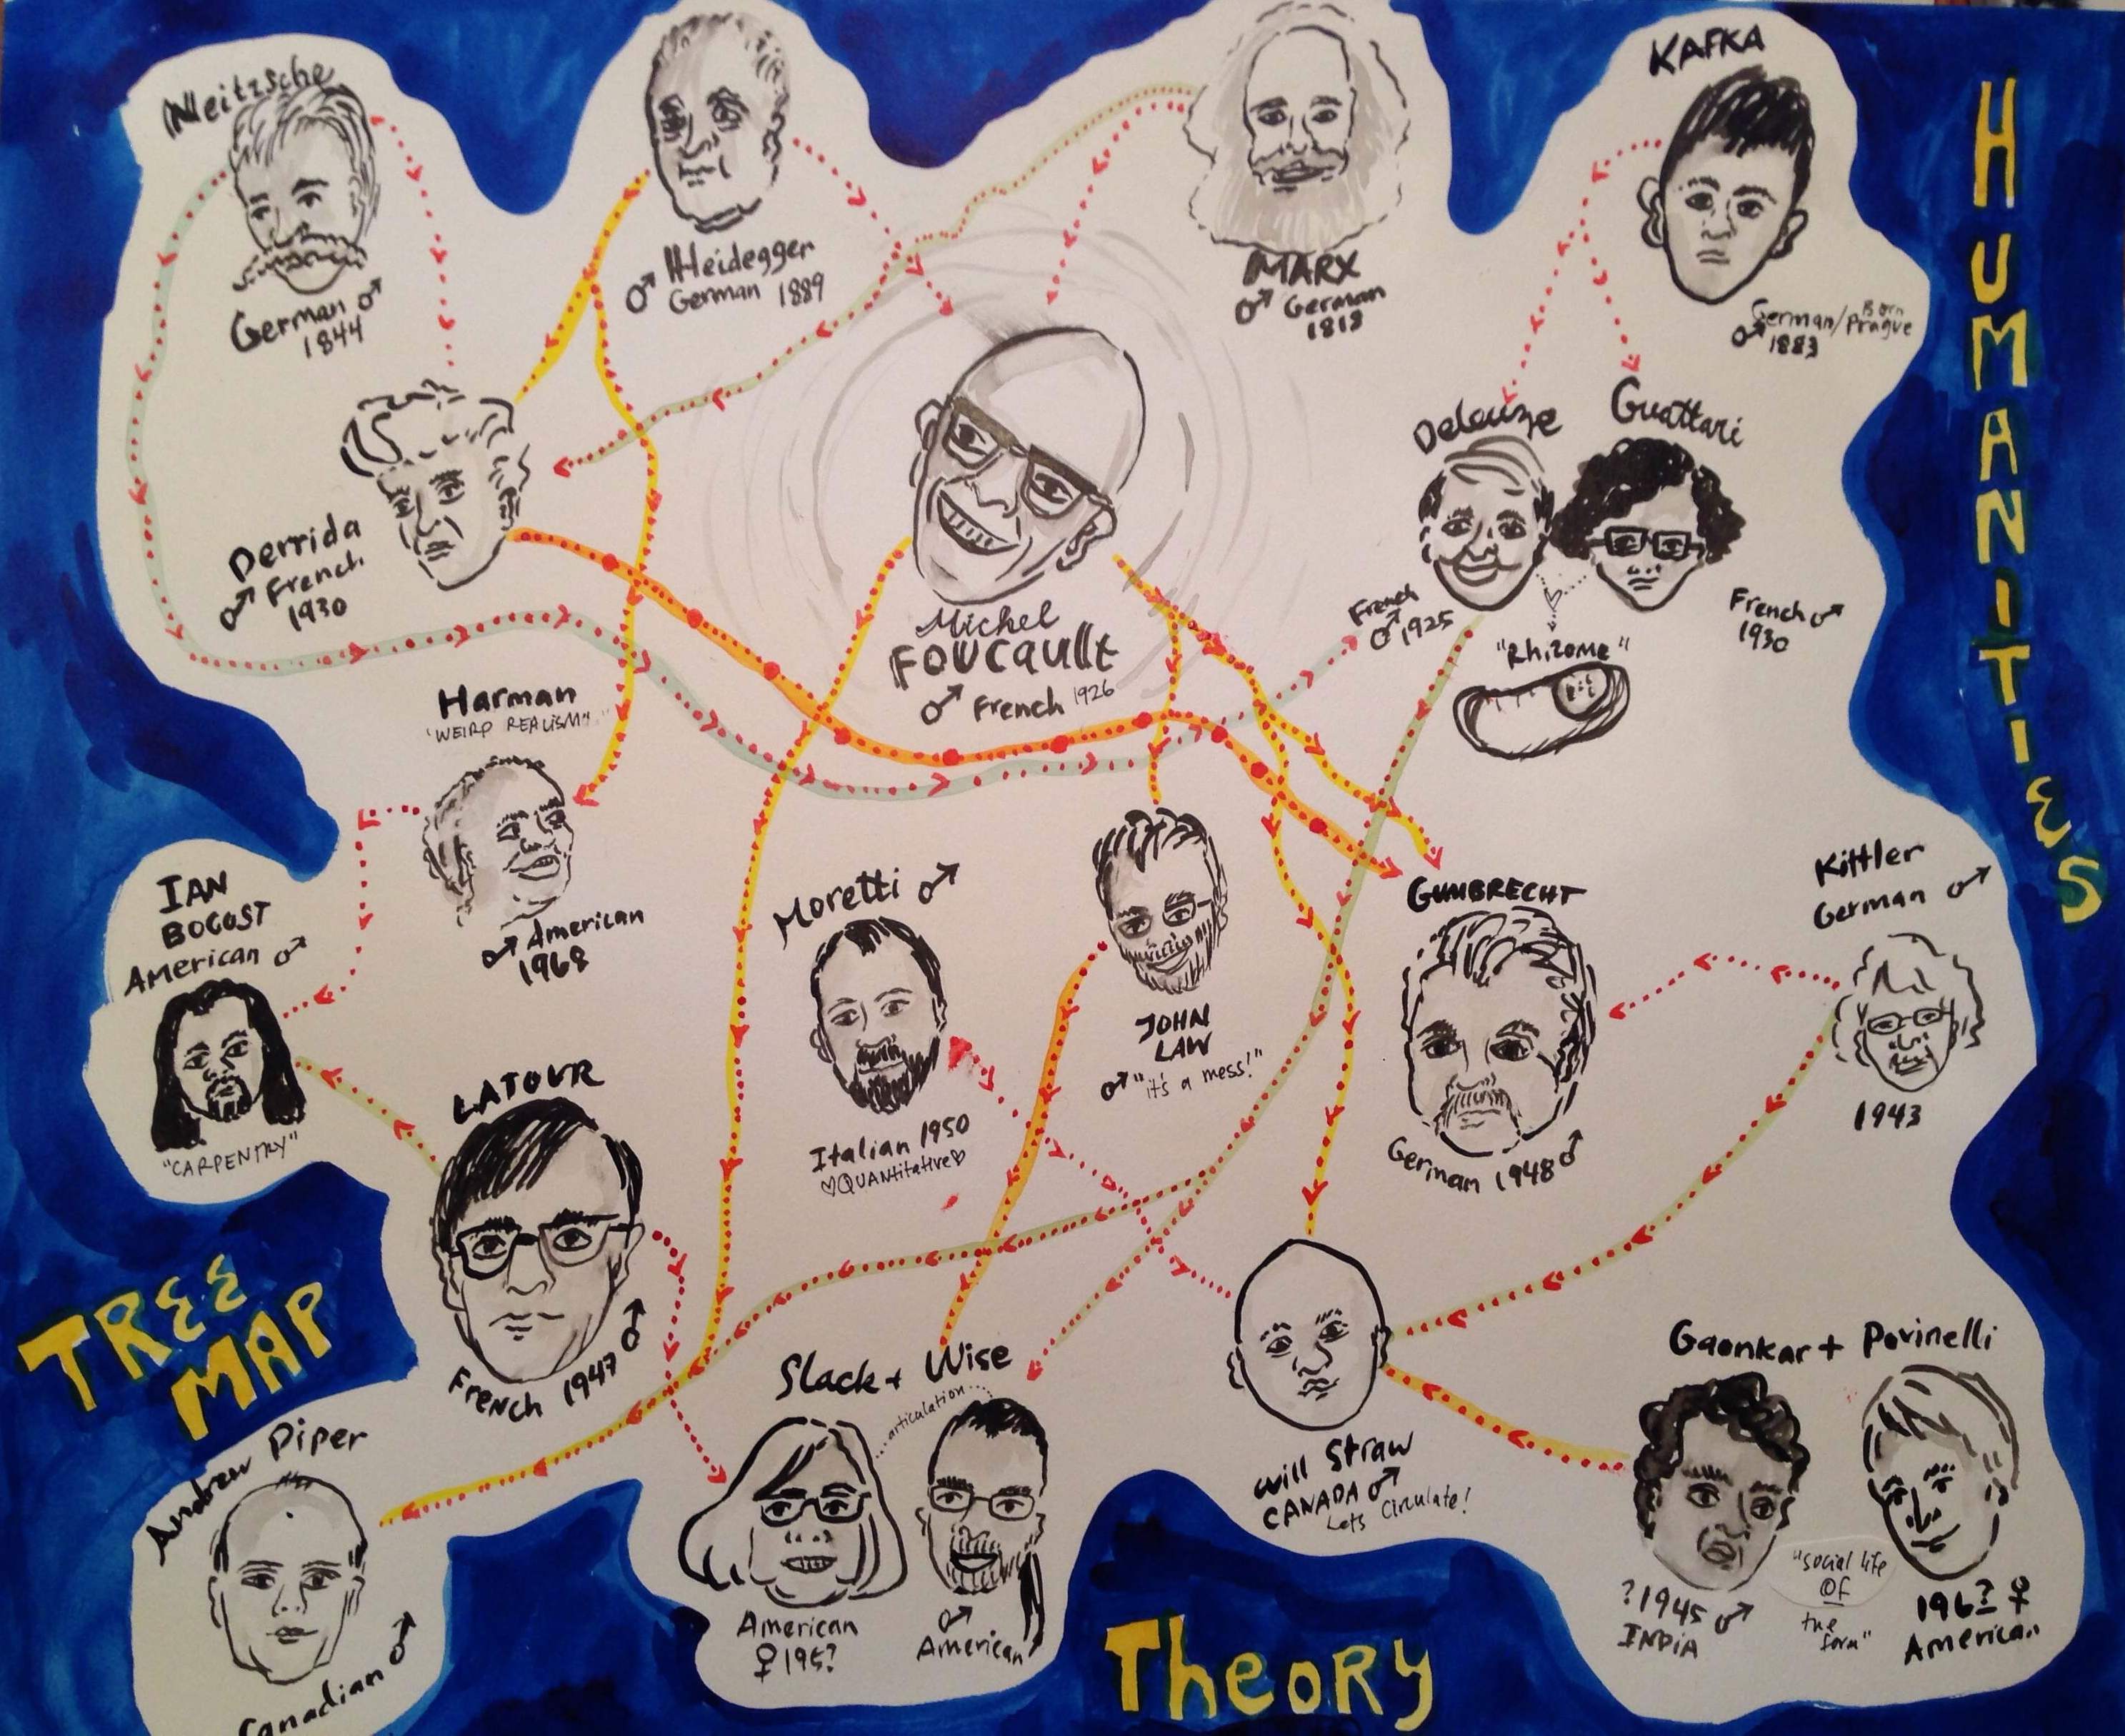
I chose to do this with my own artistic interpretation because 1) I’m horrible with computer programs, 2) It’s dead fun to cartoonize the serious theorists we’ve been reading*, 3) We can see how the cartographer’s bias can influence our interpretation of the information. My method was similar to Moretti’s method of plotting Hamlet in next week’s Network article: I went through all of the readings and marked down each writer’s direct positive references within the articles we’ve read. If there was no obvious citation, I went online and did a search to see who their biggest influences were. I, by no means, exhausted these articulations. Sadly, I had to make many omissions and simplifications in order to fit it on the page. JP Harvey’s Deconstructing the Map and its warnings about the cartographer’s inherent bias is well taken.
My initial plotting of the theorist tree:
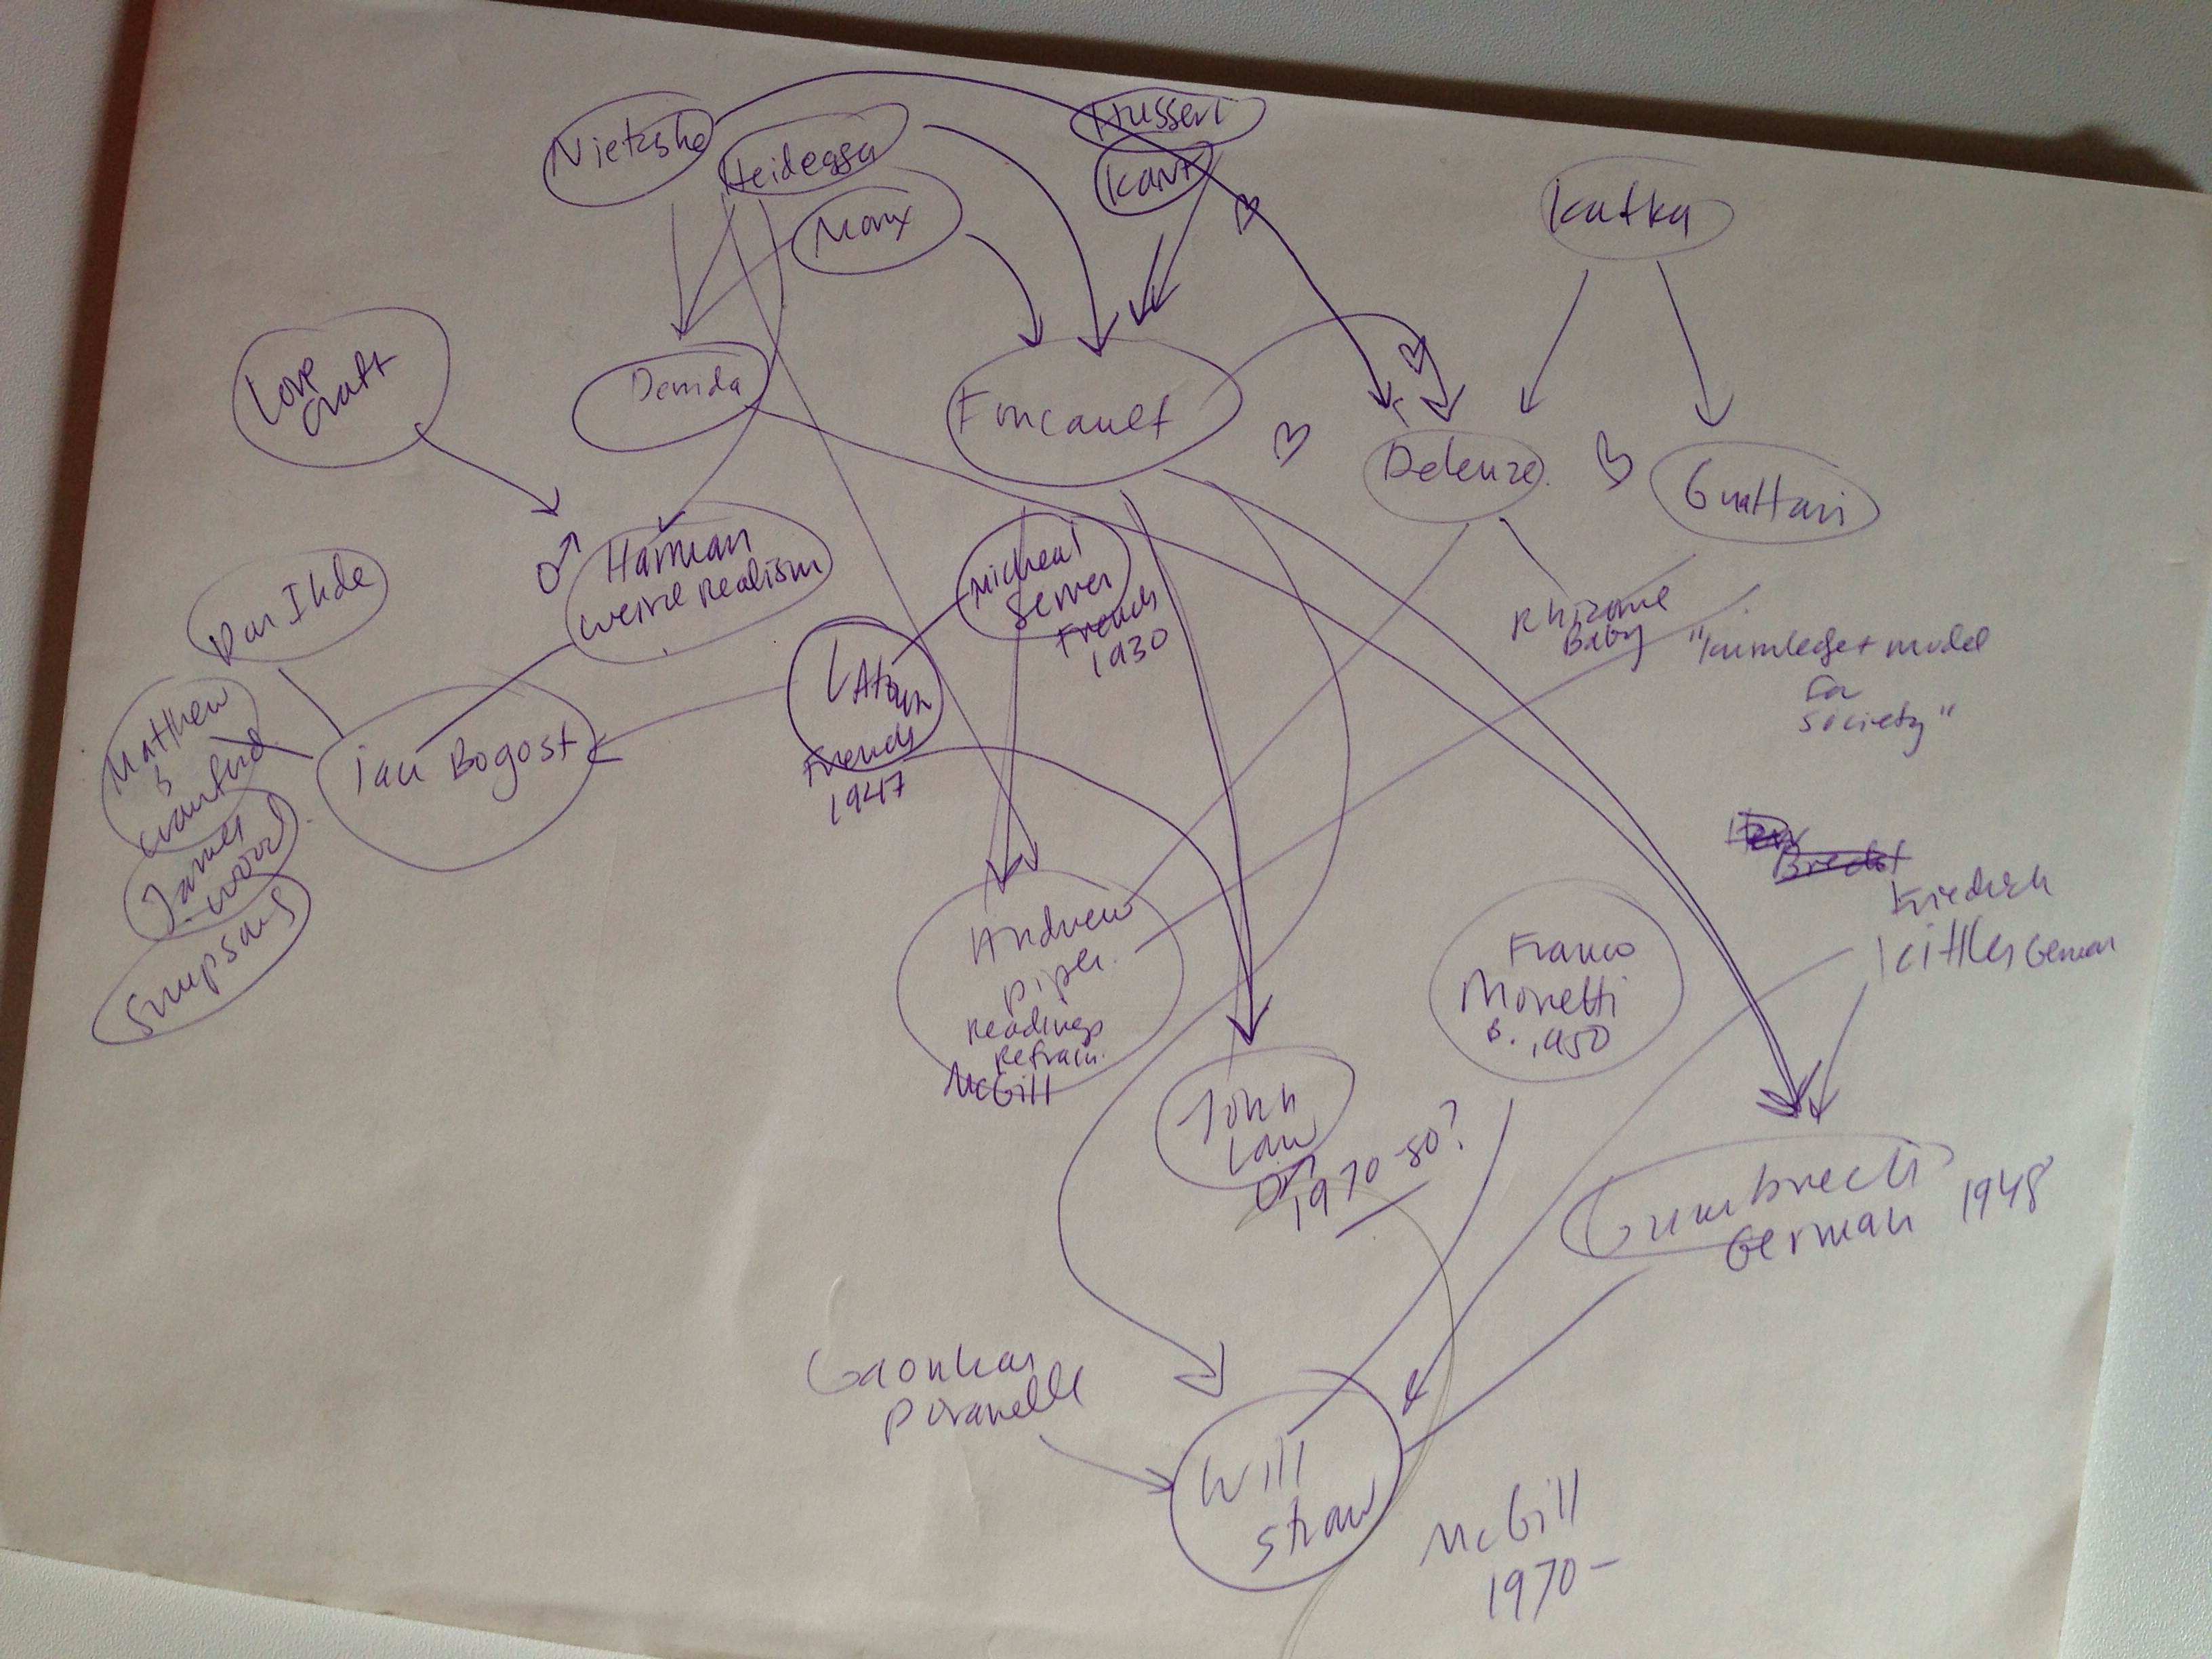
Although it looks like a network graph, it’s really a tree: I loosely placed them from oldest (top of the page) to youngest (bottom of page). And even though it’s messy – it actually does help me see things:
- If you want to be a theorist in the Humanities, you should probably grow a mustache.
- Foucault is by far the most referenced writer in our readings.
- There are other prominent authors that reference within the Humanities less but are referenced more (Moretti, Latour). Does this speak to writing style or more independent or interdisciplinary thought?
- If you do this long enough and are awesome at it, you will come to be referenced by last name only. Also, if you are in collaborative pair.
- Weirdly, there is little symbiotic sharing of intellectual love (other than the collaborative pairs). Most of this seems to simply be because of generational spans.
- At first glance, I thought: of course, it’s all a bunch of white guys from Germany and France. But if you look more closely at the ‘generations’ from top to bottom, you can see that even just in the last 50 years, the field has become much more diverse. I’m not sure if this speaks to the field at large or if Darren has just done a good job of making a point to include these scholars.
To place myself within the spaghetti dinner of thought, I’d probably plop myself down right below Moretti, John Law and Slack and Wise. I feel comfortable there in all directions: Mess, visual representations the present new information to the humanities and Articulations and Assemblages. Interestingly, these scholars are inspired by some of the others that I simply can’t get into – but now, seeing the lineage, feel closer to.
What do you see? Can you see anything at all? Does it help to clarify things or just confuse you? What does humor do to the information? Where are your pathways?
*Making Foucault look like the evil mastermind in the middle was a bit of an accident. Or was it?
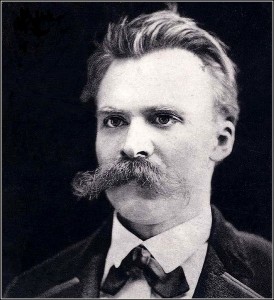
And, just for fun, the winning mustache goes to: Nietzsche.
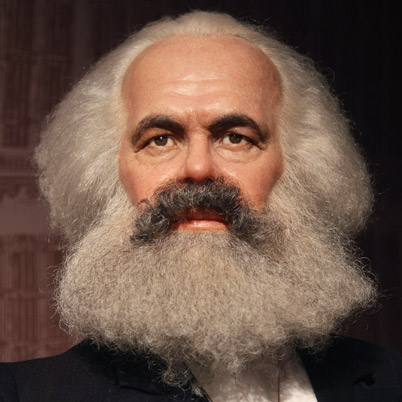
The winning overall hairstyle: Marx.
References:
Goodwin, Jonathan, and John Holbo. Reading Graphs, maps & trees: responses to Franco Moretti. Anderson, SC: Parlor Press, 2011. Print.
Harley, J. B., and Paul Laxton. The new nature of maps: essays in the history of cartography. Baltimore, Md.: Johns Hopkins University Press, 2001. Print.
Moretti, Franco. Graphs, maps, trees: abstract models for a literary history. London: Verso, 2005. Print.
The post Bootcamp: Our Humanities Theorists Tree-mapped appeared first on &.
]]>The post Bootcamp: Tree Map, Murder, and Mayhem in Shakespeare’s Titus Andronicus appeared first on &.
]]>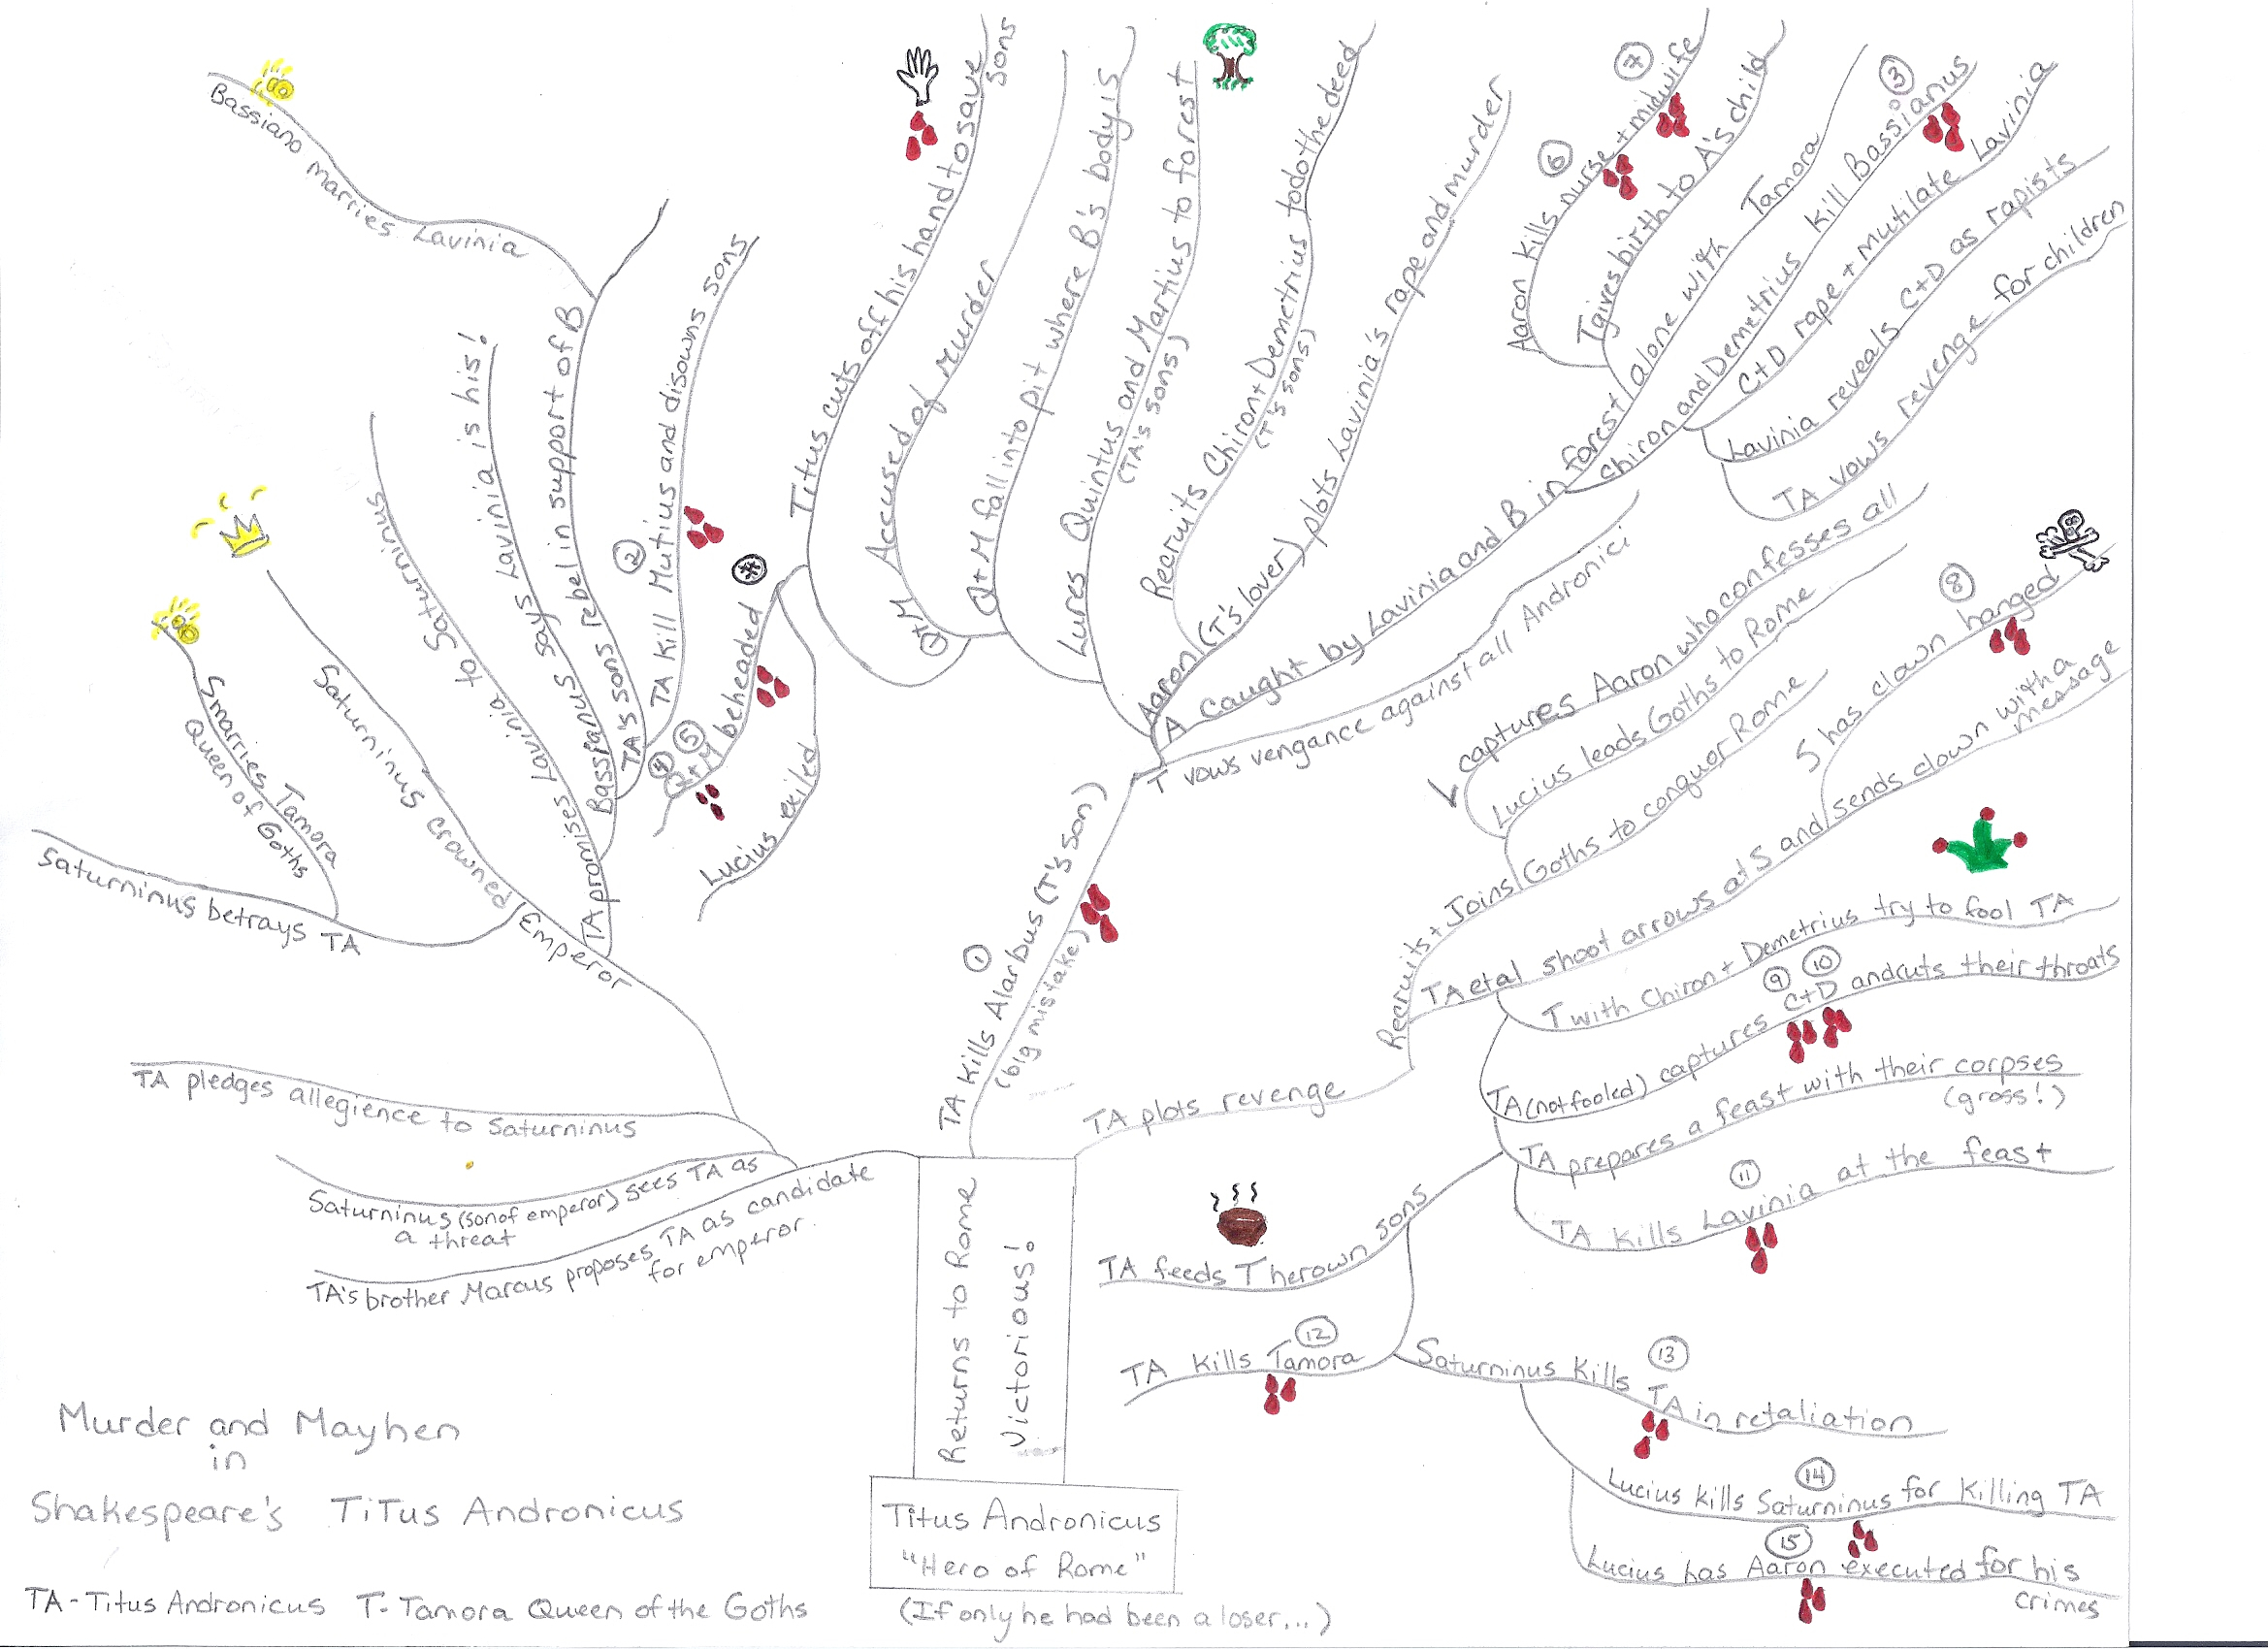
Titus’ Murder and Mayhem Tree Map
It looks like a tree, but I meant for it to be a map. I wanted to map out Titus’ destructive decline in Shakespeare’s Titus Andronicus. Titus Andronicus is my favourite Shakespeare play. The murder and mayhem is unrelenting and shocking. The first time I read the play I kept going back and forth in the text to count how many people had died. When I reread the play for the bootcamp, I was shocked anew by the brutality exhibited by the characters. I chose Titus Andronicus because I finally wanted to decide, for myself, the reason why Titus’ life goes downhill in such a spectacular manner. Is it the fact that he is a victorious general and therefore a threat to Saturninus? Is it his refusal to show mercy by ordering Alarbus, the oldest son of Tamora Queen of the Goths, dismembered? Or is it his overweening devotion to Rome that supersedes even familial ties? Or all of the above? Who does most of the killing? This play would have actually been great to graph (who kills and how many they kill, how they kill, percentage of characters left alive at the end…). I had originally wanted to “map” out the progression of the play hoping that a visual representation would shed some insight on it. Then I realized that mapping, according to Moretti, involves actual maps and distances, and that what I was creating was a tree (once I read Moretti’s third article). The tree allows me to visualize the play without having to flip back and forth between pages. Creating the map revealed quite clearly that there are three main branches to the story. First, that a triumphant Titus is a threat to Rome’s ruler Saturninus and that Titus’ overwhelming desire to be everything to Rome is detrimental to the rest of his life. Saturninus’ consideration of Titus as a threat to his power is beyond Titus’ control. Titus would have had to have been defeated in war for that to happen. Secondly, the first decision he makes when arriving home triumphant, to show no mercy and sacrifice Alarbus, is his first big mistake. He could probably have prevented all that happens to his family based on this decision, as Tamora would have had no reason to take revenge on all Andronici (if one assumes she would actually act differently). Finally, the third branch is Titus’ revenge. His revenge leads to pretty much every main character’s death, including his own, except for Marcus, Lucius, and Lucius’ son (and some minor characters who only appear once).
Who is the most murderous character? Why it is Titus! Fifteen people die, and it is Titus who kills the most at six murders: Alarbus (he does not actually do the deed but does pronounce his fate), Mutius (his son), Chiron, Demetrius, Lavinia (his daughter), and Tamora. So although the reader is supposed to be sympathetic to Titus, considering what he has sacrificed for Rome (or maybe disgusted by him as he puts Rome before his family – who knows?), he is actually the most murderous person in the play. So, how is the reader/playgoer supposed to feel about Titus knowing that he is responsible for most of the killing? He does start it after all. Should I feel sympathetic and argue that he is forced to take revenge or argue that his actions at the beginning of the play decide his fate? After seeing the map I would have to say that he brings on his own doom. Saturninus is next with four murders/executions: Quintus and Martius (Titus’s sons) – actually, they could be attributed to Aaron who frames them but Saturninus does give the order so… Saturninus also hangs the hapless clown who conveys Titus’ message (offstage), and stabs Titus. Lucius and Aaron are tied at two murders each. Lucius kills Saturninus and has Aaron executed (offstage), while Aaron kills both the nurse and midwife (offstage) who witness the birth of his son with Tamora. Finally, Tamora’s sons only kill one person, Bassianus, but commit the most heinous crime of the play (in my opinion), the rape and mutilation of Lavinia. Although Tamora eating her sons is pretty gruesome. As a reader (or watcher) one starts to wonder as the play progresses (and the bodies pile up), who is next and how will they die? I feel that any deeper meaning the play might offer is subsumed by the salaciousness of the relentless violence. Even the map ends up providing only a list of who does what to whom. Therefore, I’m not sure if the map helped me see clearer at all, it just made it easier to count the bodies.
I got ideas for mapping not only from Moretti’s “Tree of Culture” (54), but on the Internet as well. I have never made a mind map before and I found that the mind maps I Googled were precisely what I was envisioning in attempting to map the play. I was old school in that I used pencil and paper to draw the map. I decided to mark every murder with drops of blood and big events with symbols I could draw. Unfortunately I cannot draw so that is why the map is pretty bare. Next time, however, I will indicate more clearly who kills whom, so that it is easier to see.
Originally, I had wanted to map out the possible consequences of Titus making different choices in his life. What if he had died and Rome had lost? What would that story be? What if he had shown mercy to Tamora and not killed Alarbus? Would that have given him a “happily ever after? (Would not be much of a story though.) What about not insisting Lavinia marry Saturninus? It leads to him killing Mutius. I soon realized, however, that the “Choose your own Adventure” route for Titus would probably make a pretty boring play, or not.
Works Cited
Moretti, Franco. “GRAPHS, MAPS, TREES: Abstract Models for Literary History – 3.” New Left Review 28 (Jul-Aug 2004): 43-63.
Shakespeare, William. Titus Andronicus. The Norton Shakespeare: Based on the Oxford Edition. Ed. Stephen Greenblatt. New York: Norton & Company, 1997. 371-434. Print.
The post Bootcamp: Tree Map, Murder, and Mayhem in Shakespeare’s Titus Andronicus appeared first on &.
]]>The post Probe: Mapping The Dark Tower Series appeared first on &.
]]>What does it mean to map something that has already been mapped? (Or to overwrite a map?)
How do the technologies of mapping used affect the maps created?
Is it possible to map everything in order to avoid biases?
Do new technologies create more biases, or just different biases? (Do you lose old bias when new technologies are used, or do these technologies exploit previous biases?)
What can be produced when attempting to map the un-map-able?
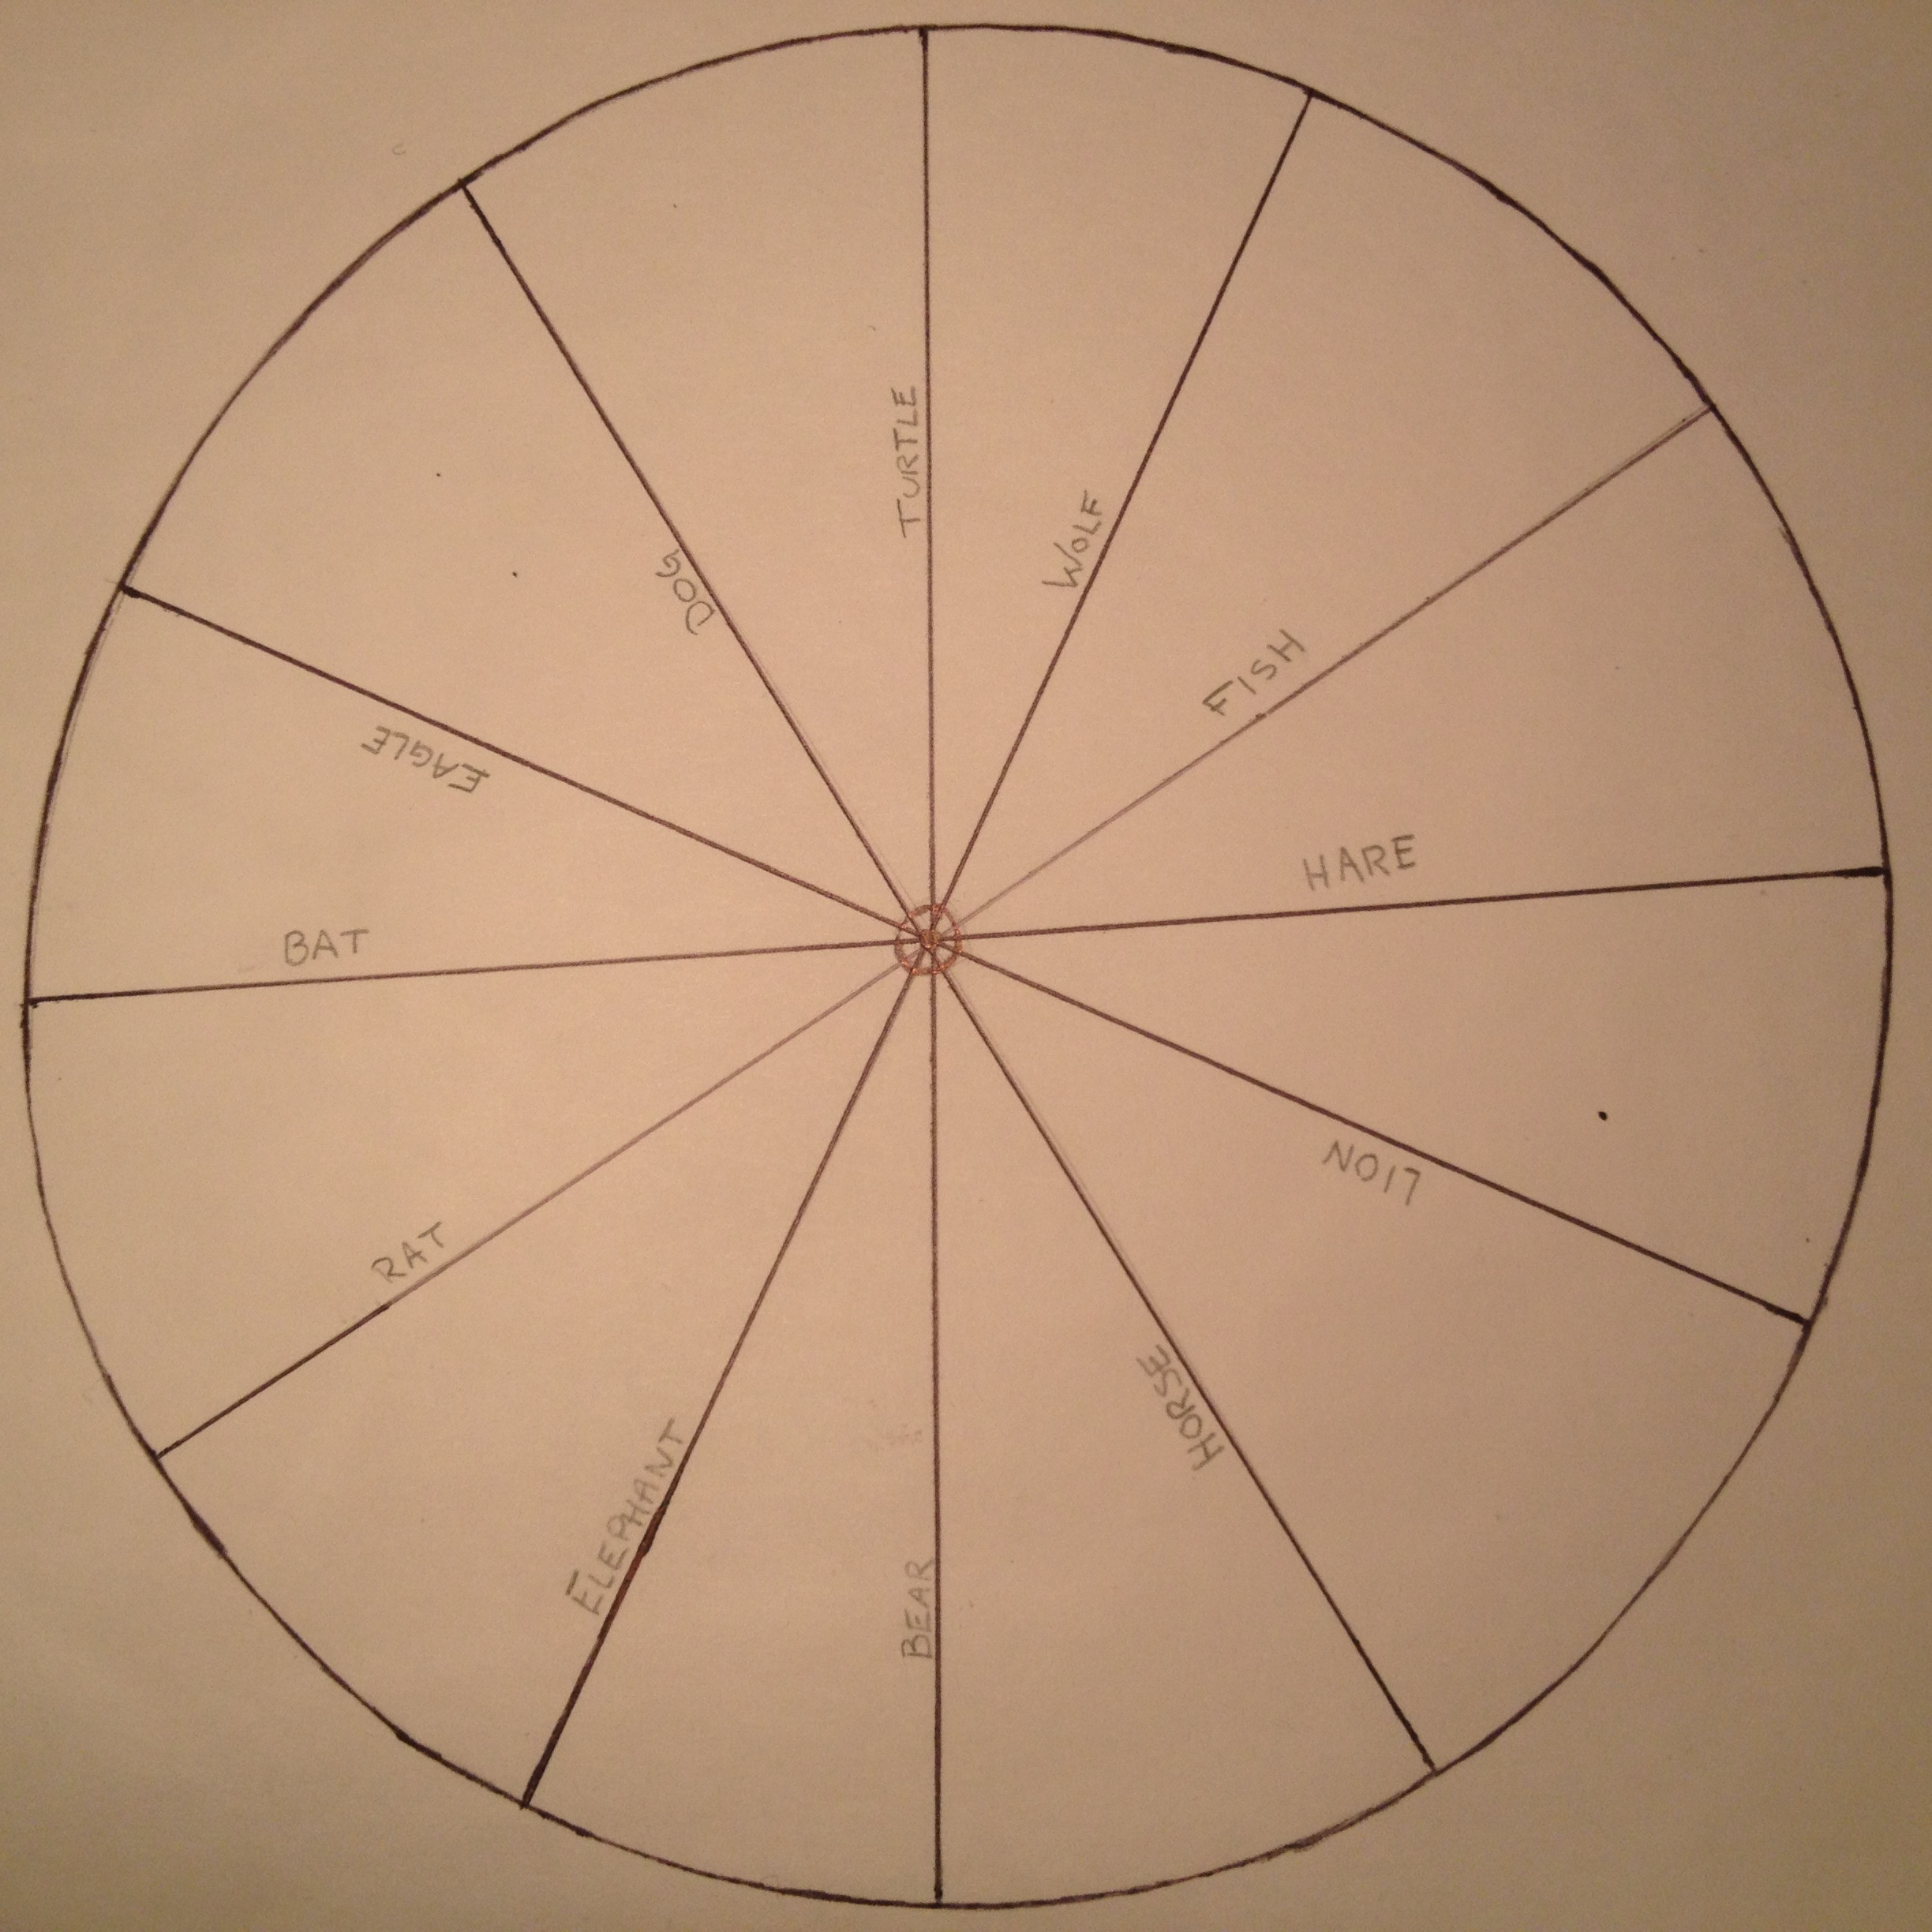
The Dark Tower series by Stephen King has multiple worlds and portals that transport characters from one world to another, relocating them in different worlds and different time periods. In order to explain how the series was mapped, I will first explain the different worlds that exist in the novels.
Mid-World is the world where the Dark Tower actually exists. This is the only world plane where it is possible to enter the tower, itself (also known as the Keystone Tower in this reality) unlike other world dimensions where the tower is represented with the use of other items (mainly a rose). Mid-World is the world in which most of the story occurs, the land on which the Ka-Tet travels, but it also more specifically tends to reference the inhabitable portion of the world (note: the most common Mid-World measure of distance is in wheels – 8,000 wheels = 7,000 miles). It includes locations such as Gilead, capitol of New Canaan barony and Roland’s birthplace, Mejis, Tull, Eld, River Crossing, Lud (a post-apocalyptic representation of New York City) and Topeka.The terms In-World and Out-World are used to differentiate locals from foreigners. “To the In-World citizens of Gilead (barony seat of New Canaan), those baronies located far from the hub of civilization were part of Out-World” (www.stephenking.com). These terms were also used to describe Calla Bryn Sturges (In-World) versus the unknown territories and those who arrive from there (Out-Worlders).
The land found between Mid-World and End-World is referred to as the Borderlands. This is the area of small towns located on the Mid-World side of the River Whye’s banks. On the far side, the land turns to waste as it continues into End-World. Thunderclap and Discordia, after which is located the Dark Tower.

Mid-World Map
End-World is the inner most section of Mid-World. Once one has crossed the River Whye, they will come across Thunderclap and Discordia, after which appears the Dark Tower, itself. Can’-ka No Rey is the field of roses which surrounds the Dark Tower. It’s important to note that each rose in the field exists as a representation of the tower in another world/parallel existence. The Dark Tower is the axle on which the entire universe spins. It is not just a physical building, but a concept bordering on that of religious worship. Interestingly enough, the tower is not just the center of the universe. It is also the outer edge of reality. For example, if one were to stand with their back to the tower and walk away from it in a straight line they would eventually run into it again at the other end of the world as well. There is no singular path to the tower, eventually if the beams are followed far enough, all lead to the tower.
Beams from the Tower
The Dark Tower series also contains different versions of Earth (as we inhabit it). There is Keystone Earth, which is very similar to “our world”. In Keystone earth time is linear. The two primary locations in Keystone Earth are Maine in 1977 and 1999 as well as (Keystone) New York City most notably in 1999 when the Hammarskjöld Plaza is built to protect the rose. New York City, alone, is a different entity, without linear time. Eddie, Susannah and Jake all come from varying New York Cities with minor differences such as Co-Op City, Brooklyn (Where Eddie is from) versus what we know in our world to be Co-Op City, Bronx. Topeka Kansas is also a part of their journey, however, it exists in a variance of Keystone Earth. Many believe that the Topeka described in The Dark Tower series is of the same realm that King wrote The Stand in – a post-plague America.
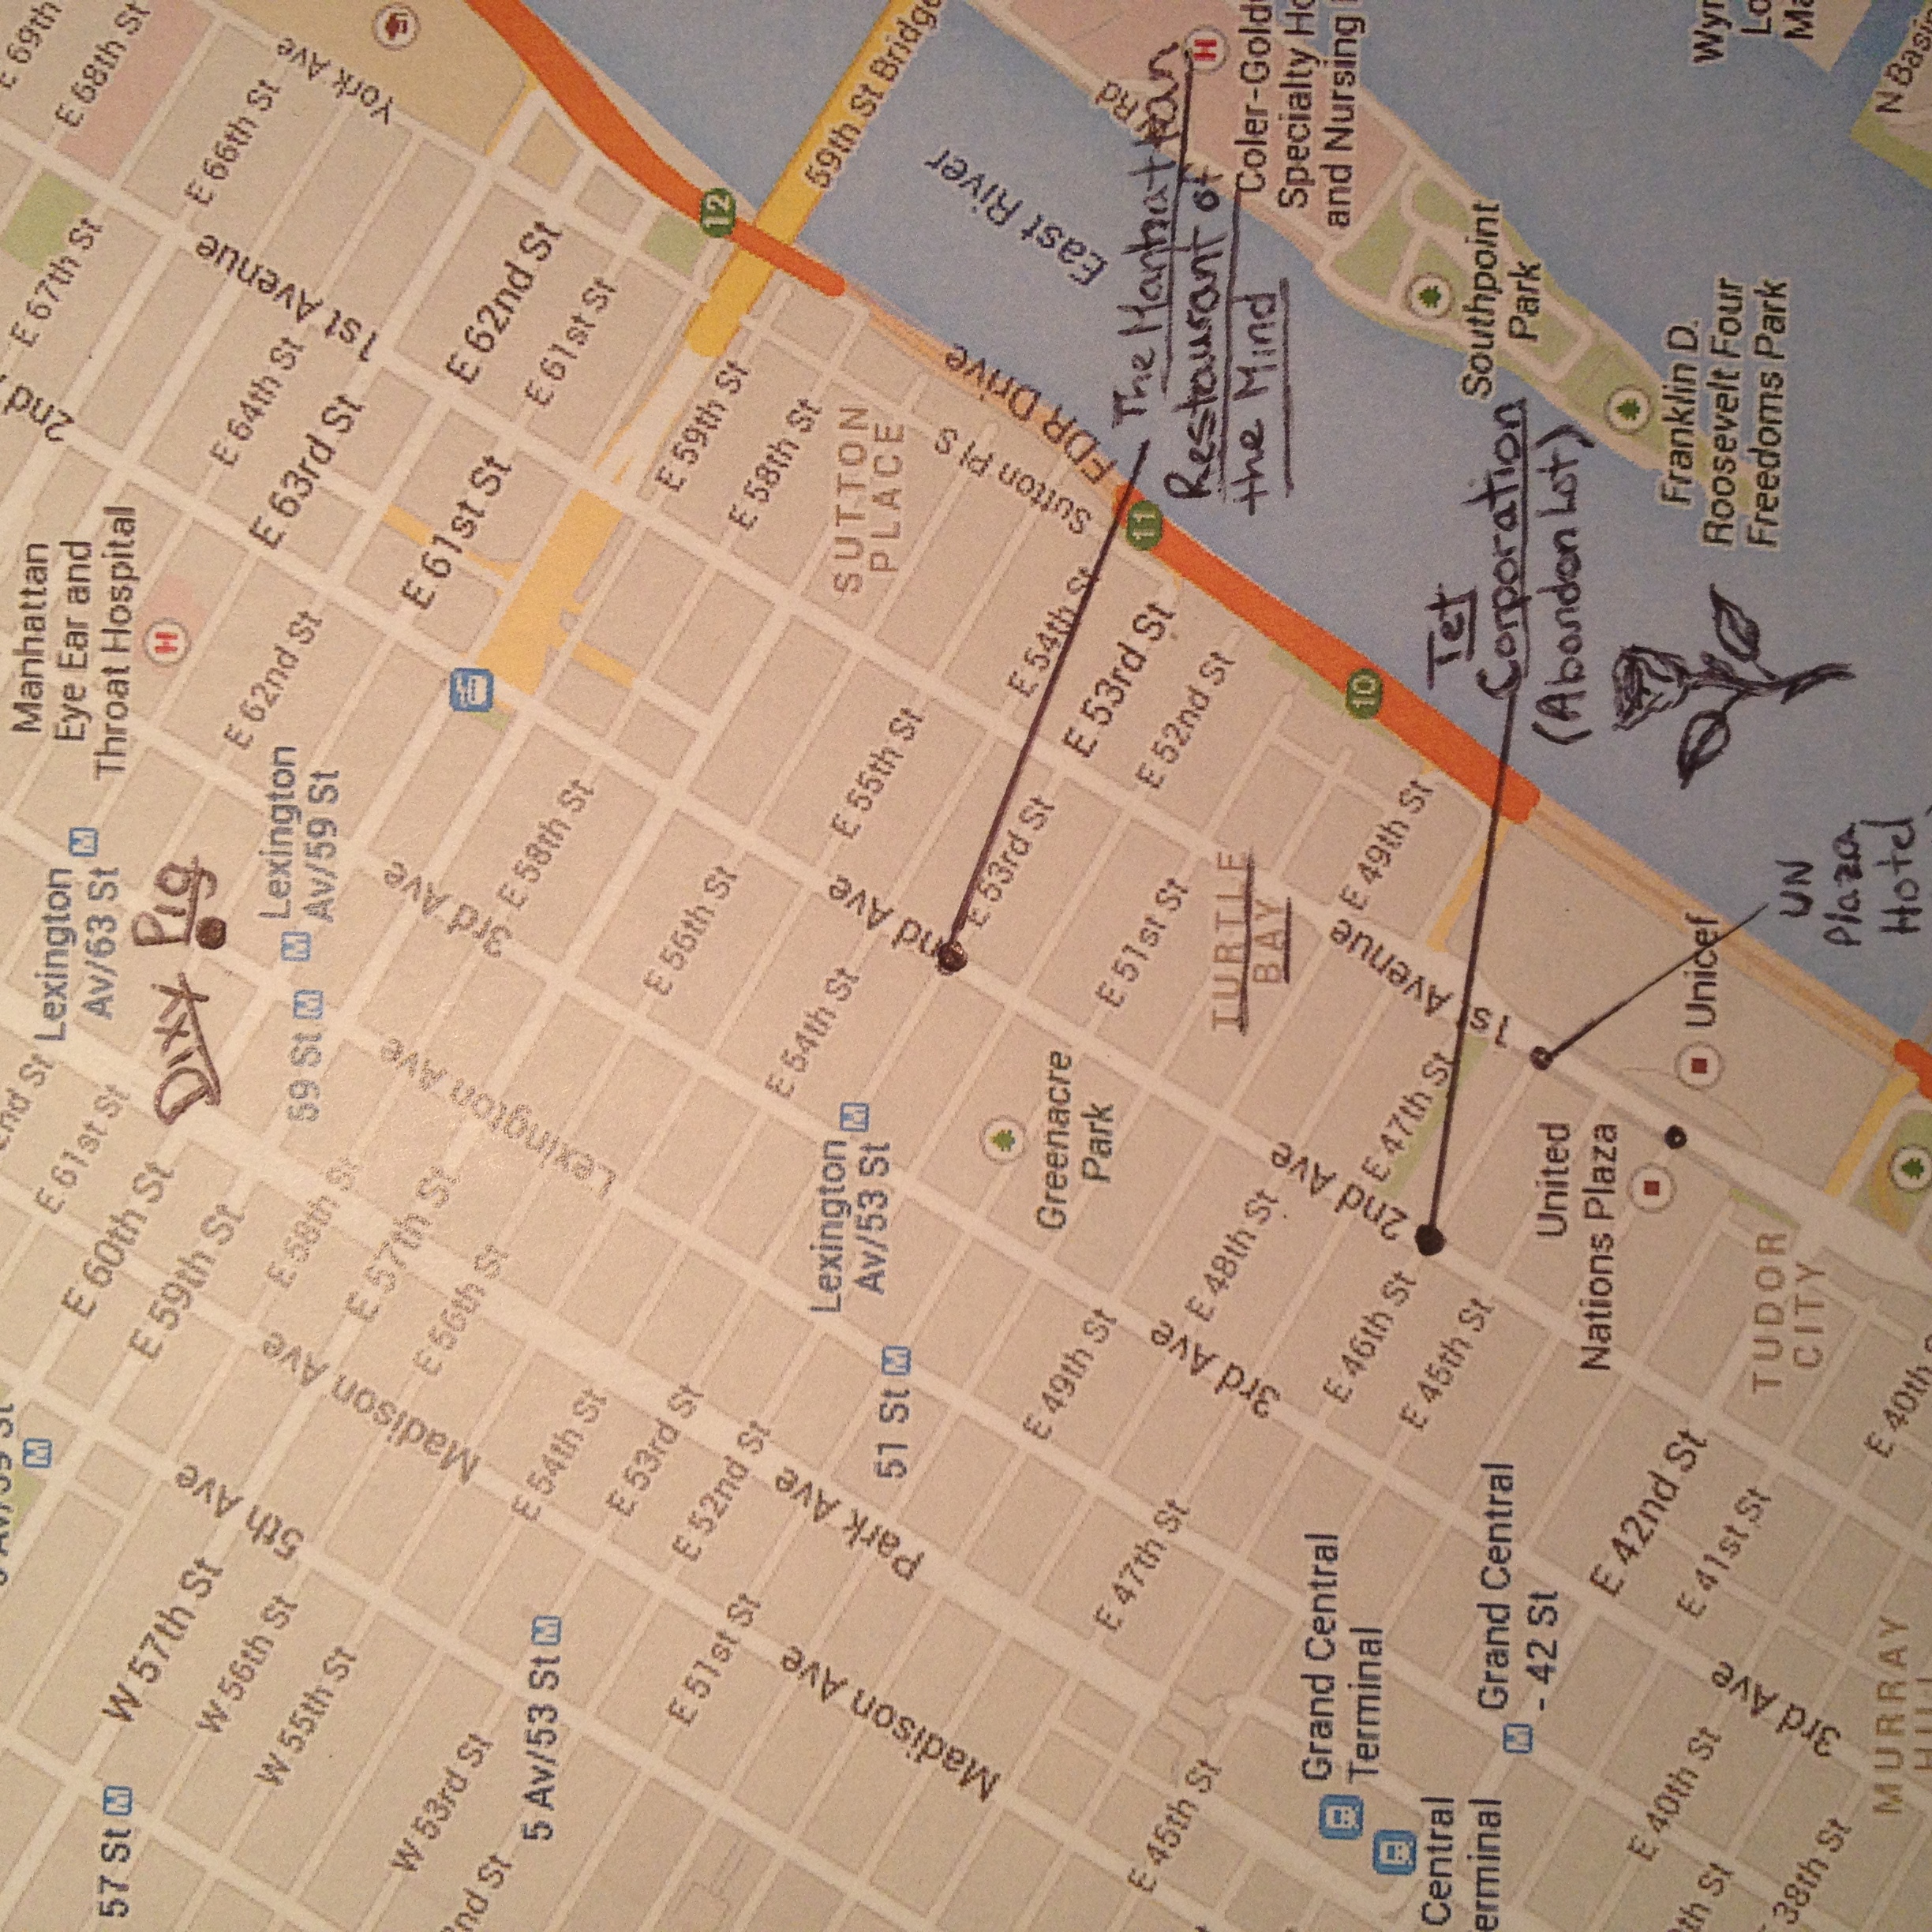
Keystone New York City
In order to travel from one world to the other and bend time, there are magic doors, or portals, that bring the characters to their desired locations. In order to complete their quest, Roland and his ka-tet must travel through time and space using these portals. This makes mapping their journey difficult.
Having described the differing levels of the map, it only makes sense to describe and justify the maps I’ve included, first, since I don’t feel that they completely do the complexity of the situation justice. The map for The Dark Tower series is not a linear. The sense of space, topography and organization of the series does not solely include one illustrated map, but numerous versions and layers, if done correctly. Not only this, but the maps must be three dimensional, or even four-dimensional space (which was something I did not have the capability to do when attempting to map the series). The tower itself is at the center of every world, but as mentioned above, it does more than just occupy a space on a map (which once again is something that I couldn’t/or didn’t know how to draw).
The marked version of New York City that is included is only one version of many New Yorks described and hinted at throughout the series. It would take months to recreate every real world reference to location as well as the alternate versions such as the location of UN Plaza hotel which, in the book is located at 46th and 1st, but in real life is found at 44th and 1st Ave. Or Eddie’s version of Co-Op City, Brooklyn versus the world we know that exists as Co-Op City, Bronx (to see someone who has devoted years of their life to this topic and different mapping techniques from real world photos to music links, visit: Blog Devoted To Dark Tower Series.
My own bias appears in the limited and select maps that I chose to represent the world(s) I’ve read so much about. Personally, I chose to stay closely linked to the Tower. This requires staying within a few mile radius in Keystone New York City to represent the importance of moving towards the world’s “center” (the Tower). I chose to hand draw the maps of Mid-World and the paths of the beams in order to better represent the period which, as presented to be post-apocalyptic, reverted back to an earlier time without the technology available anymore to create the intricacies of the territory. In regards to the map of New York City that I’ve used, it is acceptable to use modern technology since the New York Cities described have not fallen apart yet. Technology is still available to use at our leisure.
The Dark Tower series embodies (and perhaps goes beyond) Moretti’s concept of Our Village’s spatial pattern, as he states” by opening with a linear perspective, and then shifting to a circular one, Mitford reverses the direction of history…[as the readers] look at the world according to the older, ‘centered’ viewpoint of an unenclosed village” (84). The world’s in The Dark Tower is somewhat like a village story, Roland sets out to find something, and ultimately returns (spoiler alert) to the same exact place he started. However, King’s concept of time and space are not linear or even circular, as they are in Whitaker’s novel, which is what makes The Dark Tower series so interesting to map out. It makes the “stylization of space” (Moretti, 85) especially difficult to map, as The Dark Tower series challenges Christaller’s idea of “Central Places” (Moretti, 86) since the marketing and economic aspect of the books are non-existent. Most of the towns in the novels are deserted; social geography is then nulled, or completely non-important. This once again shows that this long “village story” (The Dark Tower) is organized in a looser circular pattern than the village stories mentioned by Moretti. However, the centrifugal force of the novels are evident as literally the world revolves around the Dark Tower. Therefore, despite the fact that the villages don’t offer tight centers of central spaces, on a larger scale, the presence of the tower in the center of it all pulls everything tightly towards one point on the map. By centering the novels around the Dark Tower, it is possible to understand King’s intentions and his “world view“ (Siegert, 13) as represented through Gan, the creature who lives in the Dark Tower, acting as a God-like figure.
Unfortunately I was not able to map the doors that access the other worlds, nor was I able to put all maps into one, but I do think that creating these three maps helped me better analyze the text. In creating the maps, the texts were reduced to a few geographical places that most importantly represent Roland’s travels. It is, after all, the locations written about (as they tell stories themselves) which are the most important aspects of the novels. Siegert states, “the materiality of the map interferes with its contents, and as the medium of representation interferes with the representation of the territory, the map as a representation [of The Dark Tower series] is deterritorialized by the map as the medium” (16). Perhaps it was a blessing that the intricacy of this series forced me to create multiple maps in order to best represent the world described by King. Although these recreations separate the locations from their apparent flow, and are not exact representations of the text, it also allows the audience to understand the complexity of Stephen King’s creation.
Works Cited
“DEVL Design: March 2012.” DEVL Design: March 2012. N.p., Mar. 2012. Web. 20 Oct. 2013.
“Downtown Manhattan.” Google Maps. Google, n.d. Web. 20 Oct. 2013.
King, Stephen. Song of Susannah: The Dark Tower VI. New York: Signet, 2004. Print.
—. The Dark Tower: The Dark Tower VII. New York: Signet, 2004. Print.
—. The Drawing of the Three: The Dark Tower II. New York: Signet, 2003. Print.
—. The Gunslinger: The Dark Tower I. New York: Signet, 1982. Print.
—. The Waste Lands: The Dark Tower III. New York: Signet, 1991. Print.
—. Wizard and Glass: The Dark Tower IV. New York: Signet, 1997. Print.
—. Wolves of the Calla: The Dark Tower V. New York: Signet, 2003. Print.
Moretti, Franco. “GRAPHS, MAPS, TREES: Abstract Models for Literacy History – 2”. New Left Review 26 (March-April 2004): 79-103.
Siegert, Bernhard. “The Map Is the Territory.” Radical Philosophy 169 (September/October 2011): 13-16.
“Welcome to StephenKing.com.” www.stephenking.com. Web. 20 Oct. 2013.
The post Probe: Mapping The Dark Tower Series appeared first on &.
]]>