Probe: Infographics for Graphic Lit
What kinds of graphs and topologies exist for works in the comics field?
How can quantitative data gathering allow us to perform qualitative analysis?
What work do charts and graphs perform on other media, as media themselves?
I had a difficult time writing this piece. I knew what I wanted to use, but I wasn’t quite sure what to make of my object. Much like a topological analysis, the data was all there, but it was on me to decide what to do with it. In this week’s readings, our thinkers focus in on macro- and micro-cosmic views of literature: Moretti on the large sea changes of genre and trend over time, Piper on the recurrent aspects of language in individual oeuvres. I admit closing my laptop just a little frustrated–both had focused on easily extrapolated data (well, perhaps easily is not the right word so much as simply). Where, I thought, were the topological and graphic representations of works that are constituted by a more nuanced system of signs, such as brushstroke, paint viscosity or movement? Even better, where were those that performed readings of inherently intertextual media, where more than one system of signs is at play at all times? This is the kind of thinking that’s led me directly into my research focus. For the past two years, I’ve been part of a research team (along with Darren Wershler and Shannon Tien) studying the habits of underground comics scanners, digital pirates who disperse comics online via bitTorrent sites and file lockers. A big part of our project has been backtracking through almost a decade of illicit uploads to interrogate the rhetoric of both the groups themselves and the large corporations who decry media pirates as predatory profiteers. We have initial findings out in Amodern with more research pieces on the way, but it’s taken us a long time with limited resources. I think part of what excites all three of us about the project is that when we performed our literature review, there didn’t seem to be anything else out there like what we were doing in comics studies. But a lot changes in two years, so I’ve decided to take this opportunity to look at topologies and quantitative methods of analyzing comics–those few that exist–to see how well graphs can represent the simultaneously textual and graphic.
When Friedrich Kittler talks about media, he often frames them in terms of their functions, functions he lays out as recording, storage, and transmission. How do infographics and charts work as a medium, on other media? Recording here means the gathering up of simultaneity in visual form; storage refers to the overlaying of different temporalities and cycles in a single measure; and transmission we can think of in terms of circulation as proposed by Gaonkar and Povinelli. So these charts then are conduits for the data they contain, but can also be seen as powerful tools for shaping data itself and the cultures that produce and consume them. Following Madeline Akrich, I want to argue that technical objects like charts and graphs participate in building heterogeneous networks that bring together actants of all types and sizes, whether humans or nonhuman (Akrich 206). To this end, I think we can use quantitative methods to make qualitative statements not just about content and form (as if those weren’t enough), but also about cultures of exchange and the ideological protocols underlying cultural production.
Take for example the One Million Manga Pages Project. This ambitious endeavour downloaded content of almost 900 manga series available as ‘scanlations’ (fan-translated and digitally circulated Japanese comics) on onemanga.com (as well as user-generated metadata like genre demographic tags) and then began using supercomputer-powered custom digital image analysis software to detect trends and variations in the graphical languages of manga. (Manovich et al 192). The One Million Manga Pages Project is not just geared toward analyzing the tropes of manga qua manga; it’s also directed at using this initial large data set as an exemplar for future digital humanities research. At the same time that the project is striving to make qualitative statements about manga as a culture industry, however, it’s also necessarily gathering information about the circulatory practices of manga in fan communities. By doing something as simple as examining the quality of scanned pages and then cross-referencing the types of series being scanned, the project can try to identify the common features of scanlation culture and manga itself simultaneously without depending on expressions of rhetoric that are undoubtedly biased. As the saying goes, a picture never lies. An easy finding? In figure 1 we see how black indicates the ‘credits page’ scanlators attach to their translated and scanned files, while white points towards manga tropes of two page splash spreads and black border indicates the occurrence of flashbacks. Now that the tropes are positively identified, it’s much easier to pose questions of why and how.

(figure 1: zoom ins of the One Piece visualization, a grid composed of some 10,461 pages. Manovich et al. 208)
But what does a million pages of fan-translated and scanned manga actually look like? Again, it depends of the kinds of questions you want to ask. Here they are when what you want to know about is the contrast of texture and color scale (fig. 2):

(figure 2: 1,074,790 pages of manga graphed where the vertical represents articulation and the horizontal represents the range of grey tones. Manovich et al. 222)
Here the quantitative question pertained to how gradations of gray tones related to fine texture and amounts of detail. The vertical (Y) axis charts the increasing use of fine linework on a page on the ascent, while the horizontal (X) axis charts the diversity of gray tones on the page with the right trajectory indicating nuance. From here, the project can ask all sorts of qualitative questions, from questions of the ‘style space’ to whether or not distinct and systematic visual differences exist between mangas created for different ages and genders (Manovich et al 223).
While massive data sets can give us knowledge about comics technique, it only takes one person with a large collection and a creative eye to visualize comics content in an revealing way. Graphic designer Tim Leong’s Super Graphic consists largely of entertaining topologies (fig. 3) and selective and somewhat subjective fan service (fig. 4), but also contains a lot of useful reference material for sorting out comics content. From disentangling decades of convoluted continuity in one chart (fig. 5) to identifying the color tropes of morality in mainstream American superhero comics (fig. 6), Leong may have, however inadvertently, created a useful reference handbook that can help guide not only scalar readings, but close readings as well.

(figure 3: Batman theme quantified. Leong 34)
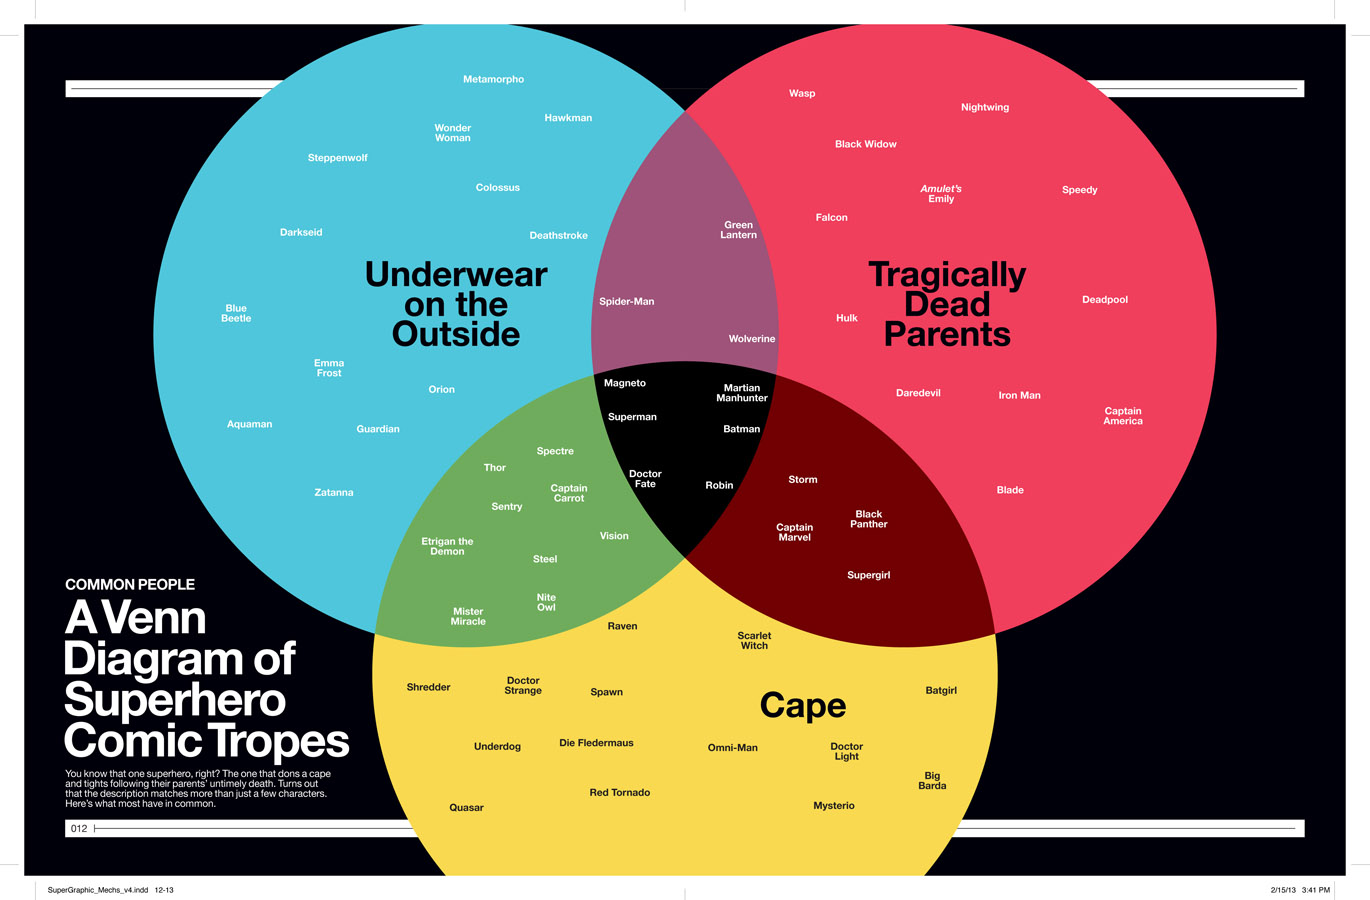
(figure 4: superhero venn diagram. Leong 12-13)

(figure 5: Marvel hero affiliation chart. Leong 74-75)


(figure 6: apparently, good and evil are a matter of primary and secondary. Leong 10-11)
These quantitative scalar methods are also being used to analyze reception of comics works, which in turn can help us figure out how we want to go about generically categorizing works in a field that has always proven notoriously difficult to classify (Delany 1999, Meskin 2007, Groensteen 2006). Comics scholar Ben Woo has performed a study of Quebecois cartoonist Guy Delisle’s oeuvre using Amazon.com reader reviews to see how audiences collectively aggregate description. Poring over reviews of Delisle’s books looking for descriptors (fig. 7), Woo was able to build evaluative frames that he then charted in a multiple correspondence graph where proximity is based on similarity (figs. 8-9).

(figure 7: reviews of Guy Delisle’s books sorted into genre descriptors. Woo slide 8)

(figure 8: the evaluative frames Woo generated based on the reviews he examined. Woo slide 12)

(figure 9: this multiple correspondence analysis of Delisle reviews has allowed Woo to observe that those who dislike Delisle’s work have a higher variation of reasons for doing so than those who enjoy the books. Woo slide 14)
This allows us to gauge the trackable response to Delisle’s work based not on official press reviews or a simple metacritic number, but instead on the classifications made by casual readers, evaluations Woo has even been able to sift into areas based on ambiguousness of commentary and positivity indexes. In figure 9, we can observe that negative or lukewarm reviews are more varying from one another than the positive reviews, which are very tightly packed close to the origin in the lower left. This type of research allows us to make both statements of individual stories and the formal qualities of opinions made within certain communities.
While it would be nice if these examples represented just the tip of the iceberg of serious investigations into graphing and charting comics, it actually comprises the bulk of the investigation out there. Still, I’m disappointed. I have yet to find any form of surface reading that allows for analysis of both the textual and graphic content of comics simultaneously. Again, I’m left wondering if more perfect forms of analysis might exist. Certainly the project best suited to such a task is the One Million Manga pages endeavour, which could perhaps augment its programming to include the translated textuality of the scanlations it studies. Still, it’s clear that graphically representing these objects reveals a great deal about both the ways that the texts are produced and our own habits in actively consuming them. Moreover, it seems that this form of surface reading actually also allows for some depth analysis, even if that analysis doesn’t necessarily follow along with a hermeneutics of suspicion.
Works Cited
Akrich, Madeline. “The De-Scription of Technical Objects.” Shaping Technology/Building Society: Studies in Sociotechnical Change. Ed. Wiebe E. Bijker & John Law. London: MIT Press, 1992.
Delany, Samuel R. “The Politics of Paraliterary Criticism.” Shorter Views: Queer Thoughts & the Politics of the Paraliterary. Hanover: Wesleyan University Press, 1999.
Gaonkar, Dilip Parameshwar, & Elizabeth A. Povinelli. “Technologies of Public Forms: Circulation, Transfiguration, Recognition.” Public Culture 15.3 (2003): 385-97.
Groensteen, Thierry. The System of Comics. Trans. Bart Beaty and Nick Nguyen. Jackson: University Press of Mississippi, 2007.
Kittler, Friedrich. “The History of Communication Media.” Global Algorithm 114 (1996): n. pag. Web. 16 October 2013.
Leong, Tim. Super Graphic: A Visual Guide to the Comic Book Universe. San Francisco: Chronicle Books, 2013.
Manovich, Lev, Jeremy Douglass, & William Huber. “Understanding scanlation: how to read one million fan-translated manga pages.” Image & Narrative 12.1 (2011): 190-227.
Meskin, Aaron. “Defining Comics?” The Journal of Aesthetics and Art Criticism 65.4 (2007): 369-379.
Moretti, Franco. “GRAPHS, MAPS, TREE: Abstract Models for Literary History – 1.” New Left Review 24 (2003): 67-93.
Piper, Andrew. “Reading’s Refrain: From Bibliography to Topology.” English Literary History 80 (2013): 373-399.
Wershler, Darren, Kalervo Sinervo, & Shannon Tien. “A Network Archaeology of Unauthorized Comic Book Scans.” Amodern 2 (2013): n. pag. Web. 14 October 2013.
Woo, Benjamin. “‘Maybe they’ve mixed me up with Joe Sacco?’: Reportage, Autobiography, and the (non-)Touristic Gaze in Guy Delisle’s Graphic Travelogues.” New Narrative VI: Seeing is Believing. Unpublished conference paper. 2013. University of Toronto, Toronto, 2013.
