Google Maps as a Politic: A Conversation Between Aline & Lizy
This is our attempt to recreate the dialogue we have had while developing our Maps Boot Camp exercise. We recognized that the differences in our knowledge, personal, and academic practices/experiences would help, rather than hinder, our collaboration.
“Discussion is an exchange of knowledge; an argument an exchange of ignorance.”
– Robert Quillen
Rather than one of us attempting to write for us both, or to co-write, we agreed to write much of our Boot Camp exercise write-up as a conversation. We sat down on a Sunday afternoon with our notes and began collaborating in Google Drive on a document on which we could work simultaneously while being able to see what the other person was writing/editing. Here’s the sum of our conversations, more or less:
Lizy Mostowski: I think that we should talk about Google Maps.
Aline Lemay: Perhaps. What about the other programs Darren mentioned in the syllabus?
LM: Do we know how to use the other applications?
AL: What about something like StoryMaps? MapBox and ZeeMaps seem to be more about visualizing information to present and share–communication and aesthetics.
LM: Let’s see. [Goes to StoryMaps website.]
AL: The thing with Google Maps is that it doesn’t really seem to include a mechanism to integrate narratives.
LM: I disagree. Look. [Creates a map in Google Maps and marks a location.] You can mark a point on the map and type up a brief description of the place.
AL: I’m more interested in the narrative of the places, the stories. What about a beginning, middle, end–more or less? A journey.
LM: I think you can link up the points that you map on Google Maps.
AL: Are you sure? And how?
LM: No. But look at this website. [Goes to Museum of Jewish Montreal’s website.] These walking tours are made in Google Maps. They use Google Maps as a template.
AL: When I worked on the history gallery of the National Museum of Singapore, our exhibition design team explored Sound Walks because the exhibition content needed to be in a minimum of four languages, as we were developing a hand-held audio guide as multilingual labels are not so visitor-friendly. I wrote the scenario for the history gallery; listening to sound walks helped me create a prototype for the designers as we needed to test the audio experience to understand how soundscapes and storytellers could communicate the narrative of the nation in the theatrical settings surrounding the collections.
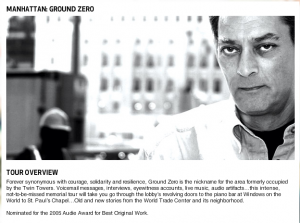
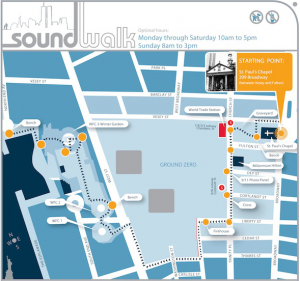
One of the sound walks we used was “Manhattan: Ground Zero”, narrated by Paul Auster, 2004. The website shows a map of the walking route, and describes the tour.
(Screenshots from: http://www.soundwalk.com/#/TOURS/groundzero/)
Available online for $1 USD, the tour attempts to recreate the intimate experience of a guided tour (pace is the sound of footsteps) at a fraction of the cost, with the advantage of an authentic and rich soundtrack. The audio has the authority of a specific guide and authentic media. I’ve never used it in New York.
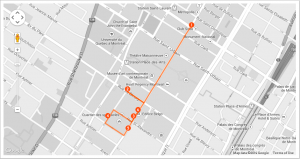
LM: I think that in relation to our project, looking at Google Maps will be the most useful. The Museum of Jewish Montreal uses Google Maps as a template. The museum is a virtual one: it does not have a physical space, its exhibits do not occupy the rooms of a building. Their exhibits are displayed online, where a visitor can experience them either from the comfort of their own home, or directly in the streets of Montreal, whenever is convenient for them, and at no cost.
(Screenshot from: http://imjm.ca/work)
The museum has only recently begun giving guided tours (for a small fee, at a set time, with an actual tour guide) which are focused in the Plateau neighbourhood of Montreal. Last summer the executive director of the museum, Zev Moses and I began talking about potentially creating a tour of Montreal’s Jewish literary scene. In these initial conversations, I sent Zev a prototype of a potential walking tour that I mapped out in Google Maps. In light of this workshop, I contacted Zev and asked him why exactly the museum chose to use Google Maps as a template on their website and not any other map application. Here’s a bit of what he had to say:
When the project was originally conceived in 2009-2010, map-based digital history was still kind of rare. […] In fact, Mapquest was still more popular than Google Maps through part of 2009! Not knowing much about web development and user experience online, I originally planned to design our own maps from AutoCAD files. A consultation with a developer made me realize that using a Google Maps API on our website would be way easier to code and update. When you run a website, it quickly becomes an imperative to give users the easiest and smoothest experience so that they spend longer on your site and visit again. This is even important in the realm of research and non-profits – we have to show metrics to prove to funders that people are using our site and that we are worth funding. Using a familiar interface like Google Maps therefore made the most sense, despite its biases and limitations. Since we came online in 2011, both Bing and Apple maps have come to compete with Google Maps and I have heard that Apple Maps is now more popular with some mobile users. As almost 30% of our users are now on mobile (versus just 18% one year ago), we may need to consider switching APIs at some point. So perhaps we may end up replacing Google Maps in the end. (Moses)
Google Maps is used for a variety of things by the everyday user, predominantly figuring out where they’re going. From your smartphone you can easily type in an address and get driving, cycling, walking or public transit directions through Google Maps that are reasonably reliable. Much more reliable than Apple’s maps, in my opinion, anyway.
AL: I have absolutely no sense of direction, driving in Alberta and walking in Montreal, and cities I’ve visited. I ask for directions. But we did travel before cell phones with Google Maps. The authenticity of the map depends on the authority of the speaker. Tour guides whose lives are part of the narrative are much more engaging because there is a personal connection with the audience: shared experiences, comments and questions about specific features of the mapped area and connections with out-of-bounds areas and past events. The audience recognizes when their guide is someone working from a memorized script written by someone else. Believability is diminished.
LM: I completely agree. I think that what Zev said about Google Maps having “biases and limitations” is interesting–when a tour is online, it seems that the map, in this case Google Maps, has to carry the authority that a tour guide would otherwise have.
AL: Yes, this is exactly what every museum exhibition is attempting to do – the experience of a personal guided tour.
LM: Google Maps is a template, not a blank page as we may assume, but rather it is more like a formatted blank document offered by Microsoft Word. However, Google Maps is not as basic a template as we assume. Google Maps, the universal tool that remembers your home address and that knows you by your email address seems as unbiased an application as any, however, like just like any other map or corporate organization, it is influenced by politics.
AL: A template? That’s not quite my understanding of the word “template” in the computer world. I understand it as a predesigned electronic formatted structure to fill in, like a letter, fax, report, spreadsheet. But I do see it as a tool that shapes the content, not a template.
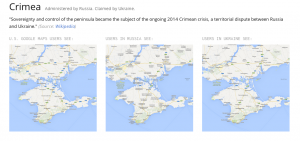
LM: Exactly. Just like templates on Microsoft Word, because of the inherent biases of Google Maps, it likewise shapes the content a user plugs into the map. In an article called “Disputed Territories” the author shows the reader twelve different geographic locations in the contemporary world where the border lines are disputed and where these disputed borders are drawn differently on Google Maps designed for different countries, which, obviously, each have their own sets of assumptions about the border. The most familiar example (at least to a Western audience) that the author cites is Crimea: from the United States you will see Crimea sectioned off from Ukraine by a dotted line, from Russia that line becomes solid, from Ukraine’s perspective there is no line at all.
(Screenshot from: http://opennews.kzhu.io/map-disputes/)
Simply stated, if you are accessing Google Maps from Canada, your map of the globe will be different from that of people accessing presumably the same map from Russia, Ukraine, and China, for example. This perhaps proves Bernhard Siegert’s statement that, “maps contain less information about a territory than about the way it is observed and described” (Siegert 13). Google Maps is playing it, as my dad would say, “politically correct” by showing a country the map of the world or of their territory as they understand it or know it to be. However, Google Maps is playing it so politically correct that it allows one to question its reliability. Google Maps is playing both sides of the fence. As an app that many of us use daily and rely on, not only as a template for projects but also as a map to get us from point A to point B, we expect it to show us the right map. This discrepancy makes one question whether Google Maps is showing us the true map or the map that we want to see. Google Maps as a politic: How are maps influenced by our beliefs? Can we use Google Maps as a template for our projects if it carries its own biases? How are these biases transferred onto our projects?
AL: I have questions about the uses of Google Maps as a tool. Isn’t it as J. B. Harley wrote in “Deconstructing the Map”, that it is “a cold thing, a map, humourless and dull” (Harley 1)? How will a digital tool enliven it? It seemed we were both just as curious about mapping as a verb, as we were about maps as a noun.
LM: Yeah. The act and the process of mapping is just as interesting as the artifact it can produce.
AL: My own, limited museum exhibition experience with maps is choosing to include them as informal learning components for certain exhibitions, but unless the map is deemed a significant component of the exhibition storyline, it will only appear in a corner, not on the main path.
LM: That’s interesting, when I think of a tour or accessing a scene from a novel, I think of geography as a point of access, not as something that is off the main path in the corner.
AL: For the “Empress of Ireland” exhibit, the immigration route – by sea and rail – was communicated with a large, colourful table-top map on which museum visitors – children – could move wooden trains and boats to travel the routes of immigration from Europe to western Canada in 1914. For the exhibition, territory was combined with how immigrants travelled. So the map informed not only geographical locations and proximities, but the voyage. Quotes from Rudyard Kipling’s writing about his shipboard experience, including the wireless shack, were positioned along the main exhibition path of “Empress of Ireland”. How is the amount of time required to travel from one location to the next, via specific modes of transportation and distances, part of a digital map?
LM: That’s what makes Google Maps so captivating as a tool. Not only can you create a map in Google Maps, not only can you virtually stroll the streets in Street View, you can use it to suggest a route, to estimate travel time.
AL: In addition to “Disputed Territories”, I searched for TED Talks about mapping. An application of Google Maps is Google Map Maker. Here is what I found:
LM: Google Map Maker is like the map version of Wikipedia, except without the obligatory footnote: anyone from around the world can use their memory or knowledge of a place to help map it further.
AL: I was particularly taken with Lalitesh Katragadda’s TED Talk: ‘Making maps to fight disaster, build economies’ that showed how this application could help save lives by providing the tools to the locals, who have the lived experience and knowledge to map their own land. I grew up on a farm and know that local farmers, like my dad and brother, understand the land and weather patterns as well as external ‘experts’.
LM: When a cyclone hit his hometown, Katragadda points out that without a map, it was impossible for relief to get to the victims of the natural disaster. Katragadda cites a shocking statistic—that as of 2005, only 15% of the world was mapped (Katragadda). By using Google Map Maker as a tool, locals were able to map the devastated locations for relief workers to be able to access the area.
AL: In “The Circulatory Turn,” Will Straw writes, “The transformation of variable behaviour into stable structures is evident in the more banal ways in which digital communication interfaces stabilize shifting relations of distance and mobility between people” (Straw 19). The stability and banality of Google Maps is valuable within the context of a natural disaster, but what else can Google Maps do?
LM: Google Maps is the cause of new social phenomena. Going back to the Street View perspective of the application, one can, for the first time in a digital format, use Google Earth and Street View to retrace their steps through visual memory. There is no other application that can create a story like this one:
Saroo Brierley’s story is used here is an advertisement for Google Maps and Google Earth. His story shows a new application to the global online map application: one can find a location not based on GPS coordinates, an address, or even a town, but rather one can find a location based on visual memory. In Katragadda’s TED Talk and in Brierley’s personal history we have two phenomena showing what this politically correct, corporate tool can do to change the world and our relationship with it.
AL: Google Maps is more than a ‘cold’ thing if a boy’s visual memory – growing up with a map on the wall and retracing his steps on Google Earth by following train tracks – can reunite him with his family. A tool with an intriguing mechanism of place and memory is murmur. Icons are posted in neighbourbood locations, and people call with their mobile phone to hear oral histories about the geographic location they’re in. It was first established in Toronto’s Kensington Market in 2003.
LM: Speaking of Kensington Market, working on this project and thinking about Google Maps as a tool has made me wonder about how Google Maps can be used as a research tool, specifically how I could apply this knowledge to my MRP, if it would even make sense to complicate my MRP further, and whether or not I should present the class with a working prototype of my MRP geographically mapped out. I then realized that I’d asked my supervisor to buy me a map of Israel when she visited last summer, acknowledging that it would be helpful to my writing process to visualize the locations one of the authors I am working on was describing in his memoir. And now that I really think about it, I’d also asked, a few months before that, for another professor visiting Poland to get me a map when he went there as well, claiming that I felt I needed a visual of Poland when I wrote. So clearly, maps are very important to my thinking process when I’m writing, but how can I use them as a research tool?
Of course, before putting maps of Poland and Israel on the wall in my living room around my desk, I asked my roommate if she would be okay with it. I realize what Harley is pointing to in his article: that there simply is no map that isn’t political. Even if I am studying with the map, hanging the map on my wall, or just looking at the map, I am engaging with it in a very political way. I also realize how helpful geography is to my thinking about the two memoirs I am studying—at different points in each memoir both authors are describing Toronto’s Kensington Market. Their separate lenses on the same physical space are entirely different as both authors lived in the neighbourhood, though decades apart. One author’s relationship with the neighbourhood shows her closeness to the Holocaust—her experience was of Yiddishkeit when the area was predominantly populated by Jews directly from Eastern Europe, while the other author’s experience was more contemporary—reflecting the neighbourhood’s cultural diversity and the author’s struggle for satisfying his nostalgia for an Eastern European Jewish atmosphere he never experienced firsthand. Finding where these two authors meet geographically was poignant for me to realize simultaneously their closeness and their distance, and forcing me to define just what that was.
AL: So to our class activity…
AL & LM: What does it mean to map a fictional narrative onto a “real” map? We realized in our thinking that there are three different layers of geographic location in a typical narrative: concrete location (an actual address is stated in the narrative), general location (a landmark, neighbourhood, city, region or country is named), and referential location (a place can be located by visual knowledge of the geography). How do these different layers of geography inform one’s reading of a narrative? How does one’s familiarity with a place texture their experience of the place in a narrative? How do issues like distance between settings in a story inform the narrative? Why does an author use specific locations to geographically situate a narrative, leaving certain locations concretely located while leaving other locations vaguely located?
LM: I think another aspect to consider when mapping literature is curation. Which locations are you choosing to include when mapping a narrative? Which locations are you choosing to omit? Why? I think that something Zev Moses said in that same email he sent me is pertinent to thinking about this issue: “We try to tell a logical story to our users that teaches them about a broader theme, while also making sure they can walk the tour in a somewhat linear fashion and in a fairly reasonable amount of time” (Moses). Geography, Moses reveals, informs the curation process, as a tour needs to function in real time and space. He mentions the digital exhibition, Work Upon Arrival, to show how fifteen oral histories were narrowed down to just six because of their geographic locations:
Ultimately, through an iterative process that combined creating a narrative of a generic immigrant’s experience (from arrival, to finding work, to working conditions, to unionizing and striking), along with making sure the geographic area of these experiences was somewhat confined and didn’t take the user in circles, we decided to place the tour/digital exhibition along Ste-Catherine. But what we lost in breadth actually created a really compact and legible tour that I think can give anyone a good sense of Montreal’s Jewish immigrant and labour experience in the early 20th century. (Moses)
How can we apply this knowledge of tour/exhibition curation to using Google Maps as a research tool to apply to literature?
Works Cited:
“Disputed Territories.” Open News. Web. October 26, 2014.
Harley, Jacob. “Deconstructing the Map.” Cartographica 26.2. Summer 1989. Print. 1-20.
“Manhattan: Ground Zero.” SoundWalks. Web. October 26, 2014.
Moses, Zev. “Quick Question.” Message to Lizy Mostowski. October 25, 2014. Email.
“Saroo Brierley: Homeward Bound.” October 15, 2013. Google Maps Channel.YouTube. Web. October 26, 2014.
Siegert, Bernhard. “The map is the territory.” Radical Philosophy 169: September/October, 2011. Print. 13-16.
Straw, Will. “The Circulatory Turn.” In The Wireless Spectrum: The Politics, Practices and Poetics of Mobile Media. Editors: Barbara Crow, Michael Longford, Kim Sawchuk. Toronto: University of Toronto Press, 2010, pp. 17-28.
“Work Upon Arrival.” Museum of Jewish Montreal. 2013. Web. October 26, 2014.
