BOOTCAMP- data mining my gmail
It all began for me with Franco Moretti’s notion of distant reading. The basic premise is that a whole corpus of knowledge is missed when you read closely. We have the tools to analyze mass amounts of data- “big data”- the likes of which we could never read, and this analysis yields new content and methods for the knowledge.
I was immediately curious to find an application of big data analysis to my own set of interests. But I soon realized I did not really have a pertinent question whose answer could be found via this type of analysis. Most of my questions of interest were philosophical questions or phenomenological ones. How could large data help answer these questions? If my question is “what is the experience of music?” then how is a large data pool going to help me? How does big data help us understand experience?
Then I realized an important distinction which came to me from both Kierkegaard and science:
In science there is both induction and deduction. Deduction begins with a hypothesis and then looks at empirical evidence to test that claim. Induction begins with empirical evidence and then from that empirical field makes hypotheses. I realized that I had to begin with induction. I had to begin by looking at data and only from that would a hypothesis come.
Kierkegaard helped because I wasn’t exactly looking for a hypothesis, but rather a question. Kierkegaard believed that all of the scientific disciplines were making the world easier and more efficient. He decided that his task was to use philosophy to make the world more difficult. I did not want to come to a solution, or a hypothesis. Rather I was hoping to use the data to come to greater complications about myself or the world.
So the question became not, what question should I start with, but what data sets should I begin with? As a philosopher and phenomenologist it began to make sense to me. Change what you are looking at- alter what you are experiencing- and then new claims and new questions can come about from that altered experience. It was big data that would allow for this shift.
I quickly realized exactly where I needed to begin- my email. I had the same email account for about 10 years. I have approximately 80,000 archived emails. Email as letter writing marks relationships and marks memory. Currently I have certain impressions of relationships and memories of how they occurred. However, sometimes memories form as a result of a glossing over or re-framing of experience. Many times, after an event, we form a story of that event in order to have a particular effect, in order to display a certain self-identity. This is what is so advantageous about documentation. It can reveal to us aspects of past experience that we have glossed over or covered up. What was I covering up about my relationships? And how could big data help me to see these?
I immediately began to see if there was something out there that could already do this; a pre-existing program so I didn’t have to any hard work (perhaps a misguided assumption to begin with). I immediately came across an amazing tool from MIT called Immersion. Immersion uses the From, To, Cc and Timestamp fields of emails to generate a complex interactive display of personal connections that span your entire email life. As they advertise:
Immersion is an invitation to dive into the history of your email life in a platform that offers you the safety of knowing that you can always delete your data. Just like a cubist painting, Immersion presents users with a number of different perspectives of their email data. It provides a tool for self-reflection at a time where the zeitgeist is one of self-promotion. It provides an artistic representation that exists only in the presence of the visitor. It helps explore privacy by showing users data that they have already shared with others. Finally, it presents users wanting to be more strategic with their professional interactions, with a map to plan more effectively who they connect with.
So I signed up immediately. Here is what I found upon entry:
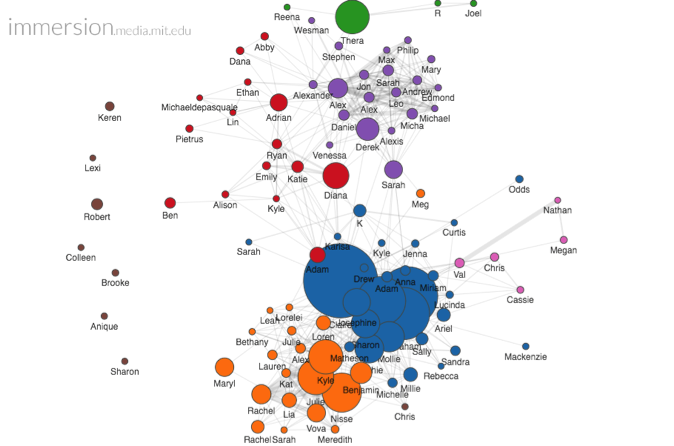
I was immediately overjoyed! You can go in and play with the spins and rotations and zooms. You can go to an individual person and see all the connections they have to others. It even tells you who a person introduced you to and who introduced you to them!
I will not go into great depth on this program, however. Why not? Because I did not find the answers I was looking for here. This program solidified for me what I knew about many of my friend groups- who they were composed of, which ones write the most emails and to whom, and the tiny connections between friend groups. But I was not interested in large claims about friend group connections. I was interested in how large data could inform me about specific relationships and my memory of those relationships.
There were a few things that this program did quite well in this regard. It gave me a timeline of the frequency for each relationship. One can adjust this timeline. And within that one can view how many of those emails were private and how many were sent to a group.
I realized then what it was that I really wanted. I wanted the ability to search for key words within emails and do more complicated analysis of the frequency and timing of those words. Perhaps the occurrence of certain words in great frequency would reveal something about that time in my life. Perhaps a discrepancy in the data for a given month would show me some part of my past I had glossed over.
I was about to embark on a rather complicated task. There was no online client that could process this kind of meta-data analysis. So I had to download the entirety of my emails- a 10 gigabyte .mbox file. From initial research I realized that the best thing to do would be convert this file to a CSV file then use various software programs to perform the analysis. I had many problems with conversion in that most of the free software that would convert the file was for PC. Also the file was so large that sometimes the conversion would not work. Finally, I succeeded, and I had a 250 megabyte CSV file of my entire email contents. However, when I tried to plug it into various data analysis programs, it would crash the program because it was too large. I had to try another route- Mozilla Thunderbird.
Thunderbird is a client that allows for more detailed analysis of emails within their email client. Essentially, Thunderbird downloads your entire email contents onto its server and then you can perform searches within its client. Here is an example of one search I conducted for the keyword “Nietzsche.”
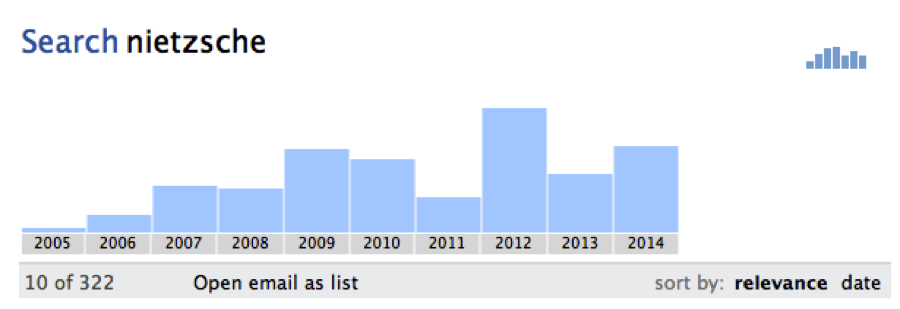
All frequency data needs to be considered alongside the fact that as each year passes the total number of emails I send and receive increases. So a low frequency of the term Nietzsche in 2005 and 2006 does not really indicate that I wasn’t interested in Nietzsche, it probably means I wasn’t using my email as much. However, a high peak of the term Nietzsche is 2012, followed by much less results in the years after does invoke curiosity. What happened in 2012?
Once you are in this graph view Thunderbird allows you zoom closer and closer to months or weeks and then see new graphs of that temporal data. I looked closer into 2012 and closer into the spring and closer and closer. I soon realized that the reason for the increase in “Nietzsche” was due to some applicants an organization I run was reviewing- two of the applicants had projects associated with Nietzsche. So it didn’t really yield any groundbreaking results. No life truths were revealed. Hm…
Still, I was pleasantly surprised by the direction it took me. Each graph was a question- why was this month more than another? Why this week? And each question took me to an email that I had forgotten about. This method, of letting the data guide you to an email, is a new method of the recovery of memory.
But why couldn’t I go further with my Nietzsche claims? It was because these applicants were messing up my data. I was interested in more existential cases of the keyword “Nietzsche” where perhaps I was sending an email giving some sort of quote about Nietzsche or perhaps arguing with a friend over some particularity of Nietzsche’s philosophy. Well, what if I was able to exclude these applicants in a search? What if I could only search for key words within emails sent only to one or two people? And again I came across another software problem. When you do a refined search within Thunderbird the graph function is not enabled. So, I had to take another path.
I had to conduct a search within Thunderbird for the terms I wanted, and then convert the results of that search to a CSV file- something made possible through a Thunderbird plugin. Then I could open the CSV file with a data analysis program called “Wizard Trail.” http://www.wizardmac.com/
I made this attempt with a different keyword. I gathered up all the emails from a past romantic relationship. Then I gathered up all the emails from that past romantic relationship that had the word love. So I had 4 CSV files. A- to girlfriend, B- from girlfriend, C- to girlfriend with the term “love”, D- from girlfriend with the term “love.”
Here is an example of the visualization I received:
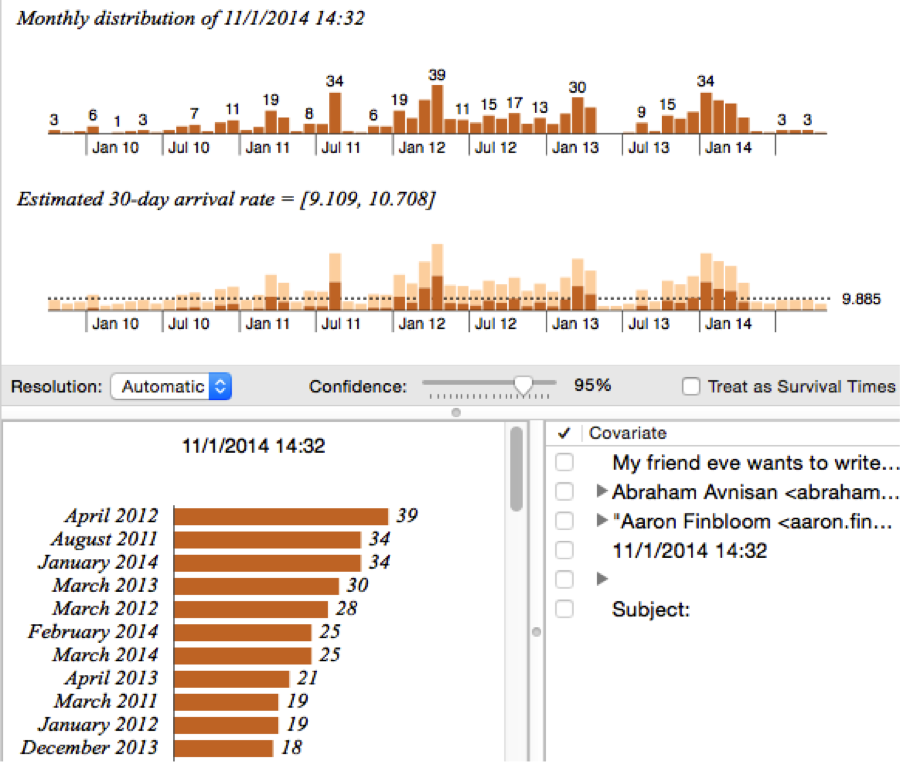
I had noticed a certain discrepancy in the month of August 2011. The emails I sent with the term “love” did not reflect how many total email I sent for that month. This caused me to search back through month of August 2011. This revealed to me that August was a month where me and my girlfriend were emailing more frequently due to an apartment search we were conducting. Again, nothing too revolutionary. So, what was I to learn about this entire experience?
Analysis of my Experiments
- Non Standard Parts? The tools I was using were not designed to be used in the way I wanted them to be used. As Matthew Jockers considers, when you begin with someone else’s program to do what you want to do you soon realize you need “nonstandard parts.” Learning to code my own program would have easily given me the ability to download my emails and then create scripts that would graph the data I wanted to see.
- More Experience? I was just beginning to use these tools. Each tool speaks a different language. If I was to give the tool more time, if I was to become more acquainted with it, then perhaps I would be better able to use it to ask questions and generate thoughts.
- I am attempting to translate one medium to another. The medium of big data – graphs of frequency, of relations of terms- to that of a humanistic and psychological phenomenology. Andrew Piper brought this to my attention when talking about topology. “It is not an attempt to say something definitive about its meaning…Instead, numeracy and tabularity are the conditions of putting words into a endless set of relations.” (Piper, 380) The process of graphing data represents a radical shift in how we understand and produce meaning. The tool of the graph perhaps shifts the kind of meaning that is produced. In trying to convert the graph to make some sort of claim about my psychology I am perhaps undergoing a “mistranslation,” and perhaps I need to change the kind of expectations I have.
- Each software program has specific drawbacks. In finding these drawbacks I was brought to understand more clearly the systemic issues with a particular program. Fuller complains that “software is too often reduced to being simply a tool for the achievement of pre-existing, neutrally formulated tasks.” (Fuller, 162) Each software program is not merely a blank slate. Behind each program is coding of culture, a coding of particular facets within culture. MIT Immersion’s aesthetic display of email connections does offer a certain degree of “self-reflection,” however it also “presents users wanting to be more strategic with their professional interactions, with a map to plan more effectively who they connect with.” Both of these “interests” are seen. Both are worked into the program. I was only able to go so far with my “self-reflection” because of it. We see this perhaps even more radically within Thunderbird’s graph display. The graph seems to function as a fun add-on to a given search. When a search gets “serious” then the graph goes away. It required me to seek out much less glitzy and popular programs such as the Wizard Trail software I ended with that eventually allowed me to perform the detailed keyword frequency search functions.
Concluding Thoughts
I want to return to a guiding question- “What was I covering up about my relationships and how could big data help me to see these?” Perhaps the entire way memory is constituted is a covering up. Human knowledge, as Heidegger pointed out, is a covering and uncovering and re-covering and re-uncovering. Lived psycho-social experience forms and re-forms our memories of experience. Data analysis of events can radically re-fashion memory along different lines- memory based on numerical analysis. Perhaps this represent a movement, as Piper suggests, away from language and meaning and towards number and relation. Perhaps my frustration was in seeking out a psychological moment that was covered up- I was looking for a moment of rupture and revelation, much like the religious reading experience of Augustine (Piper, 376). Instead, I should be looking for revelation through repetition, numeracy, topology and greater and greater entanglement.
Works Cited
Fuller, Matthew. “It Looks Like You’re Writing a Letter: Microsoft Word.” Behind the Blip: Essays on the Culture of Software. Brooklyn: Autonomedia, 2003. 137-65
Piper, Andrew. “Reading’s Refrain: From Bibliography to Topology.” English Literary History 80 (2013): 373-399
Underwood, Ted. “Where to Start with Text Mining.” The Stone and the Shell. August 14, 2012. http://tedunderwood.com/2012/08/14/where-to-start-with-text-mining/
