Posted on 2014/11/09 by

Performance, video formats, and digital publication in a Latin American context

Flaubert 20 rutas LIBRO

Flaubert: 20 rutas consists of a series of performances made by Alejandra Jiménez in Colombia, where she delivered speeches based on texts by Gustave Flaubert to random users of the Bogotan public transport system. It is an intervention in the sense that it gets to an audience without it knowing or even wanting to experience such performance, rather than the audience consciously attending an artistic event. Also, if only haphazardly, it records the reactions of the public—sometimes they clapped at the end of the speech, sometimes they would remain silent, one lady would give her some flyers and information about God. Jiménez’s reflections on her performative interventions in her MFA dissertation (also called Flaubert: 20 rutas) seek to question the implications of transit and mobility in Colombia’s capital, as well as the replacement of old buses and busetas (small buses) by more modern models, the ways in which drivers used to appropriate their units and the advent of non-place-like environments in the new buses—cold, gray, almost antiseptic (Augé 2000; Jiménez 2013).

So Flaubert: 20 rutas is actually two works or, as I usually call them in this probe, two artistic products: the first one is a series of performances recorded in low-fi video—which is not just a byproduct of the performances but, as we will see, will take them to another sort of materiality. The second one is the research-creation dissertation defended by Jiménez at Universidad Nacional de Colombia (UNC). Given that the latter was already made public by the UNC web portal, the interest in the “publication” of Flaubert: 20 rutas was focused in the videos, since it recorded the reactions of the audiences randomly “formed” by Jiménez’s interventions on Bogotá’s buses and busetas, and therefore constituted a sort of “invitation to reflection” without recurring to academic rhetoric.

The videos, merged in F4V format, were gathered and displayed in a custom-made Adobe Flash Player application interface, made under Jiménez’s commission. Given that the only non-textual traces of the performance available for “publication” were the F4V files, the interface gave them a “database aspect”. All of the 20 performances are listed together in a 5 x 4 slot interface. Each slot is randomly numerated and identified with a distinctive title or topic: “Alcohol,” “History,” “Artists,” “Turning 30,” and so on. Recording the performances makes the project ambiguous in terms of function and materiality. As in the case of PDF, which reproduces paper in a digital environment (Gitelman 2011, 115), F4V is a digital file that mediates a video recording device, which in this case mediates in turn a time-bound artistic performance. It is the recording of the recording of the performance. But whereas a rose stops looking like a rose after several photocopies, in the videos the loss is both visual and aural, since not all the background details are clear or audible.

Before discussing video file formats as cultural artifacts in Latin America it would be good to give an overview of their proliferation and the process of standardization set forth by the ISO base media file format. Just as in the case of MP3 (Sterne 2006, 826), video files are called container or wrapper file formats, a sort of metafile which may be capable of storing multimedia data along with metadata for identification, classification, and reproduction purposes. Some container formats can be reproduced across different platforms.  When I started downloading videos to play them on a computer, the most common file format for PCs was Microsoft’s AVI (Audio Video Interleaved), whereas Apple used QTFF (Quick Time File Format). Macromedia’s FLV (Flash Video) first appeared some years after AVI, and the interesting thing about FLV is that it supports streaming, making it easy to share, play and store in online digital environments, while it has a relatively small size, perfect for low-bandwidth internet technology. It became widely used by video streaming websites like YouTube and Reuters, but even before that Flash Player—Macromedia’s also small viewer application—was already popular after being integrated as a free plugin to the then famous Netscape internet browser. When Adobe bought Macromedia, in 2005, Flash Player was the most used multimedia player worldwide, either as an installed application or as a browser plugin, surpassing Quicktime, Java, RealPlayer, and Microsoft Media.

Despite FLV’s hype, when the International Organization for Standardization (ISO) came up with its base media file format, Quicktime’s QTFF was chosen as the base for standardization, probably because its potential components (audio, video, text for captioning, and metadata) were slotted in different “sub-containers”, which allows for edition and revision of specific parts without having to re-write all the information every time something is modified. From that moment, the authors of FLV have strongly encouraged users to switch to new container formats aligned with the ISO base media file format standards, such as MP4 for audio and F4V for multimedia.

Following the generalized call for standardization, the multimedia files for Flaubert: 20 rutas are encoded in F4V format. However, its quality makes it difficult to be uploaded to high-definition video websites supporting F4V, such as Vimeo, and it is more akin to low-fi environments like a great part of YouTube’s content. Although these videos are the registration of the core material for her research-creation project, the only published product so far has been the thesis dissertation. The videos allow for the ephemerality of the performance to be recontextualized in a digital environment, “micromaterialized” as proposed for the MP3 (Sterne 2006, 831-832) and therefore given a physical existence, however minute and encrypted it is. As in the initial functions given to gramophones (“storing”, so to say, the voices of people before they die), in Flaubert: 20 rutas the recording and digitizing of the performances made by Jiménez in the Bogotan public transportation system is a prime example of how to promote critical thinking out of creative events, while at the same time trying to overcome the temporal restrictions embedded in artistic practices such as music, sound art, and performance.


This probe will now raise some questions about the “publication” of the videos and its accompanying Flash Wave interface in a Latin American context. By “publication” I mean the public release of cultural artifacts through a mediation system, such as a publishing house. The work of mediation agents, such as editors and curators, has been widely analyzed by authors like Pierre Bourdieu as being fundamental for the acknowledgement of value and importance of cultural objects within capitalistic societies. Bourdieu asks who “authorizes the author” (2010, 156) in order to address how mediation agents (known in media studies as “gatekeepers”, see Shuker 2005, 117) deny the economic value of the cultural objects they promote and in so doing they “bet” for their potential symbolic value for a determined audience in a given artistic field. Without such “bets”, external and peripheral to their creative work, artists are arguably less visible in the artistic fields (Bourdieu, 2010).

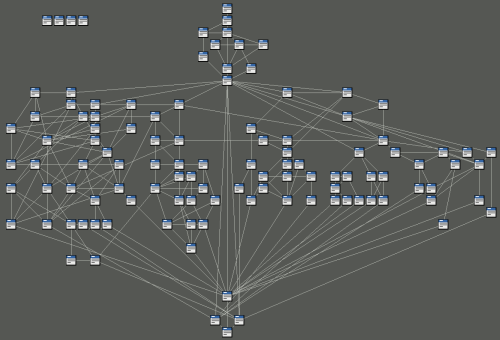
Now, this is one way of seeing it. Clearly, publishing houses and galleries are nothing without artistic products. It is the commodity they commercialize. But the articulation of independent publishing collectives has the capacity to disrupt these hierarchical types of mediation. In the case of Flaubert: 20 rutas, the initial interface for the videos (see image below) was made by a Colombian programmer, whereas some arrangements have to be done by the programmer who will upload and maintain the site (designated by the publishing collective). Extra menus will be added in each “route” to increase the navigability experience and include complementary material—either transcriptions, critical reflections, or other related creative texts. A “shuffle” or random playing function, conceived by the first programmer but not given a visual interface, will be finally installed.

As I have suggested, one of the most interesting aspects these videos show is the difficulty to realize a performative intervention such as the one proposed by Jiménez.  Randomness, which is at the very core of the creative process through the choosing of a determinate bus/audience, is reproduced or enacted several times throughout the project (the non-sequential numbering of the clusters, the “shuffle” function, and so on). In that sense, the idea of distributing Flaubert: 20 rutas for an ideally greater audience through the creation of a website interface seems to be in contradiction with the ephemerality that permeates the idea of this performance—and of performativity in general.

My concerns about the publication of this project in a Latin American context have to do mainly with functionality and accessibility. In Mexico, Colombia, and presumably in the rest of Latin America it is not common to have Flash Player installed as an application, but rather as an internet browser’s plugin. This means, on the one hand, that FLV is generally used only when accessed through streaming via YouTube or similar websites, and on the other that platform-specific formats like AVI are preferred when storing videos in a hard drive. Jiménez had the initial project of supplementing a CD with the digitized version of the videos with a FlashWave interface, which nevertheless restricted its playability to PC and impeded to play it as a DVD or VideoCD format. To understand why discussing format presentation is so important in a Latin American context, it is important to note that neither video disc players nor personal computers are commodities shared by all of the Latin American populations.

Flaubert 20 rutas

How different is the gatekeeper’s work from that of an artist uploading her/his videos on YouTube and somehow building a visualization interface for them, perhaps using predetermined template websites like Wix? The bourgeois bohemian sacralization of the artist as dedicated solely to the creative process, without being involved in the “dirty job” of getting an audience for it (Bourdieu 2010, 158), is highly responsible for the importance of mediation agents in the artistic fields. But rather than seeing mediation systems as opportunistic niches for the commodification of artistic objects, independent publishing collectives propose collaboration as a means to de-articulate the power hierarchies inherent in the work of mediation (here I’m using “work” in the same way Stuart Halls uses it in The work of interpretation, that is, as an effect exercised and set into action by mediation–the work mediation that “makes” upon its components). In that sense, most of the designing part was already done when it got to the hands of the independent publishing collective. The work of the next designer is for adaptability to the internet and “maintenance”, so to say. As they say in the editorial profession, “Everything is perfectible.” This does not mean the collective had inverted (either in economical or symbolic ways) so much as it could have if the author had not commissioned the creation of the digital interface beforehand. But it is exactly this focus on the mechanism of collaboration that can rather potentially offer a wider audience for a work that was buried under academic and temporal barriers. Of course, that does not prevent the publishing collective from adding its logo on the displaying menu, as there is in the end a collective “inversion” in the artistic product. Are the underlying structures of mediation questioned through this type of collaborative project? I do not totally think so, but I consider that it poses a working methodology open to the possibility of such questionings. What are publishing houses, then? Hubs full of nodes or links. Networks connecting to other networks connecting to other networks.

However, it is important to remember that in Latin America (and also in any other place touched by globalization), access to mediation systems is transversally restricted in terms of class/income, race, and gender. Any decision to use a technological device to transmit artistic media is therefore biased from its very conception. The practical objective becomes more fundamental than the ethical one: the technology with the biggest audience potential wins, and that is of course internet. Discs are in the process of becoming fully obsolete, just as 8-track cartridges, cassettes, and laser discs. But internet does not assure a durability of the database. The underside of internet is its potential for ephemerality. The hosting site can expire and not be renewed, and the database would be lost, if it is not lucky enough to be recorded by a database like the Internet Archive. So the “triumph over ephemerality” is probably delusional, while the supposed release of an artistic object to a wide audience is biased in transversally oriented levels.


References


Augé, M. (2000). Los no lugares. Una antropología de la sobremodernidad. Barcelona: Gedisa.

Bourdieu, P. (2010). El sentido social del gusto. Elementos para una sociología de  la cultura. Buenos Aires: Siglo XXI Editores.

Gitelman, L. (2014). “Near print and beyond paper: knowing by *.PDF.” Paper Knowledge: Toward A Media History of Documents. Durham/London: Duke University Press, 111-135.

Jiménez, A. (2013). Flaubert: 20 rutas. Bogotá: Universidad Nacional de Colombia. MFA Thesis.

Shuker, R. (2005). Popular Music. The Key Concepts. London/New York: Routledge.

Sterne, J. (2006). “The mp3 as cultural artifact.” New Media & Society, 8 (5), 825-842.

3352645-tumblr_mkylmr9ttb1sn4ul9o1_1280 copy
Posted on 2014/11/03 by

The SSHRC Proposal

The past two months there’s been a lot on my plate. Between teaching, co-curating an event, various writing projects, and being very, very sick, I’ve had little time for other commitments. But at the forefront of my mind has been scholarship applications. In October, I handed in two applications — one for FQRSC at the beginning of the month and one for SSHRC at the month’s end. I am now officially burnt out in terms of theoretical writing for the next little while, so in lieu of a weeknote this week I’ve decided to post one of my drafts for one of these scholarship applications. What follows is a version of my SSHRC program of study, basically a pitch for my dissertation project. What’s interesting and frustrating about writing these descriptions is the economy needed: a dissertation project is large and sweeping and really a chance to make your points and perform your research without compromise, but a SSHRC app is all about compromise and the number of lines you’ve got left before you hit your two-page limit. The process is thoroughly exhausting, and you don’t hand in the application with all that much hope or expectation that you will get the funding. But at the very least, I’m now left with a head start on my dissertation proposal and an updated CV. Oh yeah, and what feels like a peptic ulcer.

Program of Study
Gotham on the Ground: Transmedia Cultural Production, Fictional Geography, and the Narrative Assemblage of the Batman Franchise

In literary analysis through the 20th Century, authors were studied in terms of their oeuvres, but in the current cultural climate, licensing has inverted how fictions are produced: instead of studying prolific authors across their works, we must move towards examining popular properties across their media representations, viewing these properties as narrative assemblages and building cohesive stories from their constituent parts. My dissertation project, Gotham on the Ground, is an exercise in such an interdisciplinary methodology, drawing resources from multiple fields including Film Criticism, Game Studies, English Literature, and Media Theory. This work will enhance understandings of transmedia cultural production practices as well as studies of fictional geography. The project will draw connections between producers, audiences, and players, to develop a fuller understanding of all three, combining a Latourian Actor-Network Theory (ANT) (2005) approach with methods of distant reading taken from Moretti (2005), circulation theory from Straw (2010), and intersecting theories of cultural production adapted from Bourdieu (1993), to explore how transmedia cultural production affects narrative, character, and geographic consistency in franchised popular culture properties.

How do we account for the methods of cultural production when our media landscape is split between two disassociative views of itself—one of a creative field dominated by a rhetoric of authorship, and another of a legal field dominated by a rhetoric of ownership? As producers and consumers, we still cling to an idea of ourselves as authors dominated by creativity, while there is a growing contingency of thinkers and activists who feel that the nature of copyright within North America and on the world stage has begun to hamper creativity rather than foster it, as conglomeratised multimedia empires increasingly rely on transmedia business models, disseminating fewer narratives across more media.

Generally, transmedia storytelling “represents a process where integral elements of a fiction get dispersed systematically across multiple delivery channels for the purpose of creating a unified and coordinated entertainment experience” (Jenkins, 945). While in recent years the growing field of transmedia has been of great use in cultural studies, the concept itself leaves some gaps in the scholarly landscape; of particular concern is its inability to address issues of ideology and distinguish between storytelling techniques and business models. I propose to address these gaps—and examine the field of cultural production in its entirety—by applying concepts of differential media that I have adapted from the media poetics of Johanna Drucker (1994) and Darren Wershler (2010), and from concepts of differential textuality developed by Marjorie Perloff (2006) and Jerome McGann (2001). In differential media, even practices such as copyediting or layout design for an adaptation are integral conceptual and concrete creative undertakings, and meaning is not discoverable content so much as dynamic exchange best revealed as a play of differences in such undertakings and their products (McGann, 111). Transmedia requires an intricately coordinated process conceptualized and executed by the highest-level creative directors in order to study the interpretive impacts of one media extension of a cultural property on another. Conversely, in differential media all creative contributions are rendered meaningful, and no cultural producers are exempt from analysis. By hybridizing theories of transmedia with conceptions of differential media, I can treat the whole field of cultural production in terms of creative labour and audience reception, whether looking at singular narratives executed across networked media, or simply different interpretations of narratives adapted from one medium to another.

I take as my object the popular transmedia icon and DC Entertainment property, Batman, and particularly Gotham City, the gritty urban landscape in which he wages his war on crime. As with transmedia, scholarship on this popular icon is plentiful but contains problematic gaps. While film scholar Will Brooker’s recent monograph Hunting Dark Knight (2012) offers some insights into Batman as a transmedia discursive process, it fails to address the significance of digital media and games. Where Brooker’s approach is primarily historiographic, my emphasis is on urban space and circulation as a key element of the transmedial network, with my overall framework informed by ANT, urban geography and mobility in cities, and circulation theory. Using distant reading techniques ranging from big data gathering of over 75 years of information and thousands of comics, to a careful examination of how Gotham has been represented cartographically and aesthetically in film, animation, live-action television, and both board games and digital games, my dissertation project will create a circulatory sketch of Batman’s city, exposing the branching evolution of the cultural production of Batman as differential media, and demonstrating how the varied narratives of the franchise are beginning to converge upon a consistent vision of Gotham City as a space and place. As the map of Gotham becomes more detailed, the openings for intervention by users and independent producers shrink; these new concretizations of Gotham radically alter the nature of fan interventions and change the groundwork of the political economy in Batman’s transmedia production.

What are the varying methodologies and protocols of pop-culture transmedia production? What consequences have these protocols had on the way we view Batman as a narrative assemblage? How does Gotham City represent its own histories, both diegetically and in terms of its many adaptations? What can we glean from studying the myriad depictions of Gotham not in terms of chronological progression, but of versioning and differentials? How do the participatory cultures of game players and fan creators work in dialogue with the tightly controlled intellectual properties that make up an “official” canon? What issues of authorship, ownership, and agency arise from such a dialogue?

My dissertation will seek to answer these questions. I will begin by tracing the history of the Batman franchise through the hundreds of hands that have maintained creative, legal, and editorial control of the property since its inception in 1939, paying special attention to the nuances of the property’s (sometimes disputed) ownership and licensing, and how the versions across media take their cues from whichever is employed most successfully. This will flow into an exploration of Gotham City as an evolving fictional space in its various representations. The bulk of the project will construct an argument focused on Gotham City as a virtual space for participatory circulation and mapping, examining its representations in board games and video games, including the popular Arkham series (2009-2015) and the licensed Lego Batman games (2008-2014). I will explain how the recent game versions of Gotham City are palimpsests of the seven decades of Batman texts preceding them, and show how these game versions of Gotham are beginning to work outward from themselves, again influencing representations in other media in the narrative assemblage, but also grounding a new geographical and aesthetic consistency for the Batman media empire.

Gotham on the Ground will explore discourses of corporate cultural production, participatory fan culture, and adaptation practices as they pertain to both film production and ludic game experiences. It will investigate the fields of virtual and fictional geography, as well as the emerging traditions of collaborative world-building in video games and large-scale transmedia narratives. In completing this project, I intend to address current gaps in the scholarship of transmedia cultural production, and in doing so develop a fuller understanding of the shifting relationships between producers, users, and fans.

Works Cited

Bourdieu, Pierre. The Field of Cultural Production: Essays on Art and Literature. New York: Columbia University Press, 1993.

Brooker, Will. Hunting the Dark Knight: Twenty-first Century Batman. London: I.B. Taurus Publishers, 2012.

Drucker, Johanna. The Visible Word:Experimental Typography and Modern Art. Chicago: The University of Chicago Press, 1994.

Jenkins, Henry. “Transmedia Storytelling and Entertainment: An annotated syllabus.” Continuum: Journal of Media & Cultural Studies 24.6 (2010): 943-958.

Latour, Bruno. Reassembling the Social: A n Introduction to A ctor-Network-Theory. New York: Oxford University Press Inc., 2005.

McGann, Jerome. Radiant Textuality:Literature Afterthe World Wide Web. New York: Palgrave, 2001.

Moretti, Franco. Graphs, Maps, Trees: Abstract Models for a Literary History. London: Verso Books, 2005.

Perloff, Marjorie. “Screening the Page/Paging the Screen: Digital Poetics and the Differential Text.” New Media Poetics: Contexts, Technotexts, and Theories. Ed. Adalaide Morris & Thomas Swiss. Cambridge: The MIT Press, 2006.

Rocksteady Studios. Batman: A rkham A sylum. Warner Bros. Interactive Entertainment, 2009. Playstation 3.

—. Batman: A rkham City. Warner Bros. Interactive Entertainment, 2011. Playstation 3.

—. Batman: A rkham Knight. Warner Bros. Interactive Entertainment, 2015. Playstation 4.

Straw, Will. “The Circulatory Turn.” The W ireless Spectrum: The Politics, Practices and Poetics of Mobile Media. Toronto: University of Toronto Press, 2010.

Traveler’s Tales. Lego Batman: The V ideogame. Warner Bros. Interactive Entertainment, 2008. Playstation 3.

—. Lego Batman 2: DC Super Heroes. Warner Bros. Interactive Entertainment, 2012. Playstation 3.

—. Lego Batman 3: Beyond Gotham. Warner Bros. Interactive Entertainment, 2014. Playstation 4.

WB Games Montréal. Batman: Arkham Origins. Warner Bros. Interactive Entertainment, 2012. Playstation 3.

Wershler, Darren. Guy Maddin’s My Winnipeg. Toronto: University of Toronto Press, 2010.

Posted on 2014/10/29 by

Probe #2: Maps “What exactly do they do?”

I spent a year and a half playing Legend of Zelda: A Link To The Past.

My brother and I got a Super Nintendo for Christmas from a rich aunt and uncle in 1993 and spent somewhere between the next 18 and 20 months doing almost nothing else in our spare time but play the game. We kept a notebook where we would update each other on things that we found when our kid-schedules didn’t line up, so if we placed without each other we would know what happened, but mostly we played together, passing the controller back and forth as our different skill sets were needed (Michael was much better at boss fights, where I excelled at hidden passages).

And we drew maps. We didn’t buy and official game guide and it would be years before we had an Internet connection at home, so we made the maps ourselves. Blocky and uncertain at first, the maps would spiral out, growing rhisomatically as we explored, until we found the edges of the small, digital world.

Hand-drawn Zelda map by Daniel Brown. You can see more of his work here: https://www.flickr.com/photos/51653338@N06/4751755703/

Hand-drawn Zelda map by Daniel Brown. You can see more of his work here: https://www.flickr.com/photos/51653338@N06/4751755703/

As we made discoveries, we annotated our maps. The landscape that emerged was built up not just of the terrain we encountered, but of our experience of it, a phenomenon similar to what Franco Moretti describes: “out of the free movements of Our Village’s narrator, spread evenly all around like the petals of a daisy, a circular pattern crystallizes—as it does, we shall see, in all village stories, of which it constitutes the fundamental chronotope. But in order to see this pattern, we must first extract it from the narrative flow, and one way to do so is with a map. Not, of course, that the map is already an explanation; but at least it shows us that there is something that needs to be explained. One step at a time” (Moretti 84). The maps we made were bound and dictated by the way that we experienced the game,

The maps each of us made were were profoundly influenced by our different play styles; as the game was different for each of us, our maps had “a different geography according to who was looking at it” (Moretti 81). My maps were littered with markings about item locations, suspicious cracks in rock walls that could be bombed to reveal caverns, shrubs that could be pulled up to reveal holes, treasure chests on ledges I had yet to puzzle out how to reach. My brother drew battle lines, noted where enemies were most densely concentrated, plotted out the safest paths through traps and treacherous terrain.

Without an official map placed over the game experience we had, the maps we made were produced by the way we explored. Official game maps are much cleaner and tidier, coolly rebuffing the impulse to annotate, standardized and sanitary. Official maps represent of the game experience the game makers want us to have, with connects to Jacob’s Harley’s assertion that “maps are authoritarian images. Without our being aware of it maps can reinforce and legitimate the status quo” (Harley 14). I still find official maps too confining, to neat; I still game with a notebook next to me, full of notes and doodles — and sketches of maps.

* * *

“Things are not always so neat. But when they are, it’s interesting” (Moretti, 85).

Charting the experience of gaming through making my own maps gradually led me to writing games. As in most areas of my life despite the fact that I had no idea what I was doing at all I decided to leap in and try it via an intense 6-week workshop called Junicorn, run by Dames Making Games, a feminist gaming organization in Toronto. It was during this process, banging my head against RPG Maker and over graphic-intense game creation engines, that I stumbled on Twine.

Unlike the other engines that I had were exposed to, Twine is text-based. It’s a simple interface for interactive storytelling, game making, and choose-your-own-adventuring. It’s simple enough to puzzle out, but Anna Anthropy has an excellent beginner’s tutorial so that you can start building a narrative immediately.

Using Twine, instead of writing linearly, the narrative grows rhisomatically. As you explore the implication of every choice and the resulting options, the narrative grows and splits off. With every fracture the narrative landscape take up more ground, feeling every outward for the edges of the story. There are a lot of ways to write multifoliate texts – Scrivener is a tool that was mentioned in class before, and I have even known people laboriously write games with branching narratives on hundreds of Powerpoint slides. The nature of Twine, and what sets it apart, is that the software allows you to lay out your story visually, to see the shape of the narratives as they branch.

Eerily like maps

From OneGameAMonth Project: " 109 content passages, with 238 links connecting them, containing over 8,000 words." http://www.maximumverbosity.net/1GAM/2013/03/

From OneGameAMonth Project: ” 109 content passages, with 238 links connecting them, containing over 8,000 words.” http://www.maximumverbosity.net/1GAM/2013/03/

Moretti talks about the way maps reveal “the direct, almost tangible relationship between social conflict and literary form. Reveals form as a diagram of forces; or perhaps, even, as nothing but force” (Moretti 103). t]The structure of the game maps and the structures of the guts of Twine games — interior and exterior views of the same narrative — echo each other, revealing this conflict or tension. This also gestures towards what Bernhard Siegert says when he talks about the Aristotelian concept of hylomorphism, the relationship between matter and form as manifested within maps: “the map is the territory. In this case this means that as the materiality of the map interferes with its contents, and as the medium of representation interferes with the representation of the territory (for which representation is an ontological condition), the map as a representation is deterritorialized by the map as a medium” (Siegert 16). I was sruck by how much the form and content of game maps and Twine games echoed each other.

The connection is made even more directly in the case of the tool Inklewriter, which has the compositional option “map mode” to help you visualize your piece as you write it. In her critique of the tool, Emily Short notes the illuminating limitation “the map gets increasingly tangled and tricky to read after a moderate amount of work, and as the lines cross it’s not always clear which of the connections represent choices and which direct choice-less progress from one paragraph to the next” (Short 2012). What I find most interesting about this observation is, again, the parallels betweent the narrative map and the geographic one: as a story can get tangled — too complex, overwritten, etc. — so can narrative maps.  In the process, the medium itself becomes a constraint, a limitation that defines the sorts of stories that are being told, how many choices are available, how many branches reveal themselves.

I believe this is what Harley is talking about when he discusses “the narrative qualities of cartographic representation” as well as the “rejection of neutrality” in that neither can be disentangled from each other: cartography is narrative and narrative is cartographic, when it comes to game writing (Harley 8). The process of writing in Twine is extremely revealing about these cartographic biases, and it essentially works them out backwards: as cultural context seeps into and defines every aspect of map making, so the act of writing within a map limits the cultural production that comes out of it.

So what kind of games are produced within those limitations? Games like reProgram, an interactive exploration of meditation and BDSM, by Soha Kareem, wherein the circular, repetitive nature of meditative practice is juxtaposed with moments of violence. Some choices lead you farther away from the safety of the centre as they fracture outwards, increasing the players sense of risk and vulnerability; or, conversely, lead them back to a place of calmness and safety. Each of the player’s selections, each click, become choices toward violence to tenderness, each choice transmuted into action and changing the narrative landscape.

In games like Even Cowgirls Bleed by Christine Love, the act of selection is even more intensified: every decision is a gunshot (or, occasionally, the option is presented to holster your weapon). You must shoot to progress, revealing more text through acts of destruction, and as you pepper the game landscape with bullets it changes: tensions rise, relationships begin to erode. Every action, every choice, each necessary to propel the relationship forward, changes the terrain, making it more hostile, discovery as an act of violence.

I wonder if games, and specifically game scripts and maps, represent a space between the text and the map as Moretti imagines, a liminal space. When he talks about distant reading at the end of the chapter, Moretti states that “distance is however not an obstacle, but a specific form of knowledge: fewer elements, hence a sharper sense of their overall interconnection. Shapes, relations, structures. Patterns” (Moretti 94). As maps take stories and distill them, simplify them, reveal the shapes, in engines like Twine we see the shape of the narrative, the edges of the fictional universe, the patterns. Plus, both are meant for exploring.

Works Cited

Harley, Jacob. “Deconstructing the Map.” Cartographica 26.2 (Summer 1989): 1-20.

Moretti, Franco. “GRAPHS, MAPS, TREES: Abstract Models for Literary History — 2.” New Left Review 26 (Mar-Apr 2004): 79-103.

Short, Emily. “Choice-based Narrative Tools: inklewriter.” Emily Short’s Interactive Storytelling. September 11, 2012. Web. October 26, 2014.

Siegert, Bernhard. “The Map Is The Territory.” Radical Philosophy 169 (September-October 2011): 13-16.

Works Discussed

Christine Love. Even Cowgirls Bleed. Love Conquers All Games. 2013.

Soha Kareem. ReProgram. 2013.

Posted on 2014/10/27 by

Virtual Shtetl: Mapping as Postmemory

I first found out about Virtual Shtetl while sitting in the Warsaw Jewish Community boardroom overlooking the city’s central Pałac Kultury. I was going on Birthright—a free trip to Israel for young Jews of the diaspora—with a Polish group (the Canadian division of Birthright told me that I wasn’t Jewish enough to go, but that’s a story for some other space) and I asked how I could participate in Poland’s Jewish community from Montreal. The response I got was something like, “You could volunteer and translate the entries on Virtual Shtetl, for example, into English.”

Virtual Shtetl (Wirtualny Sztetl) is a project that seeks to unearth Polish-Jewish history that was destroyed, lost, or forgotten during the Holocaust. The Virtual Shtetl website is divided into seven main archival parts—“Towns”, “Sites of Martyrdom”, “People”, “Glossary”, “Gallery”, “Map” and “Bibliography”—of which I will focus on the “Map” aspect, which is in my opinion the most interactive and intriguing.

Screenshot from Virtual Shtetl.

Piece by piece, Virtual Shtetl reconstructs lost spaces of Jewish history by way of geographically locating Jewish places that either still exist the way that they did before the Holocaust, that no longer exist, or that exist but in a way that is no longer necessarily Jewish (for example the building that was the synagogue in Skawina still stands but now houses a convenience store) and archiving them onto their virtual map. The map is not necessarily “complete” but is well populated and most entries—particularly those for big cities—are translated. The project relies largely on donations and the work of volunteers and interns to populate the map.

Currently, their website is a resource for scholars, tourists, and locals that allows them to discover bits of Polish-Jewish history interactively through Google Maps, where they can not only search a specific town, they can go into street view and virtually stand in front of a building that was formerly the town’s synagogue and presently looks like any other house on the street, for example the former synagogue in Grojec:

Screen shot 2014-10-15 at 2.53.39 PM

The project itself is extremely ambitious. As you’ll see if you visit their website or Facebook page, they seek not only to create a map-based database of Jewish places in Poland, but also to create exactly what the name of the project indicates: a virtual shtetl—a Jewish town or community—that is in dialogue with one another online. Their description of the project on their website is as follows:

The “Virtual Shtetl” is devoted to the Jewish history of Poland. Currently, our portal is a source of information, but in the future it will also include an interactive system by which Internet users will interact with each other. It will create a link between Polish-Jewish history and the contemporary multicultural world. (sztetl.org.pl)

The goal of this project is not only to discover lost fragments of Jewish life in Poland and to map them geographically, but also to reestablish the actual community ties and atmosphere that were lost with the extinction of Polish shtetleh through an interactive website. The concept of “creat[ing] a link between Polish-Jewish history and the contemporary multicultural world” complicates this notion further as the project interacts with many of its followers through their Facebook page which is called “Virtual Shtetl Portal”, described as a space “Dedicated to the documentation of Jewish life and heritage in Poland, the Virtual Shtetl Portal is not a place, but rather the community by which it is created” (Facebook, emphasis mine). Though the project does not physically appear in the streets of small towns and in the cemeteries of big cities—there is no plaque on the convenience store in Skawina telling its patrons that the building was a synagogue less than a century ago, and it is even possible that the people who run the store are unaware that it is marked as a synagogue on Virtual Shtetl’s website, let alone that the building they do daily business in was formerly a place of worship—the project is meant to inhabit the spirits and minds of the community members it gathers through collective reconstruction of memory through mapping.

In many ways, using Google Maps as a template makes the map of Poland appear less subjective to the viewer: the map itself appears not to have any biases. However, the icons used to mark points on the map of Poland are anything but generic: the synagogue icon depicts an old-style synagogue with a rounded roof implying a wooden structure (the type that you would have seen in pre-war shtetleh), the cemeteries are marked with icons depicting distinctly rounded Jewish tombstones, the places relevant to Jewish history or tragedy are marked with rounded dark icons that resemble regular Google Maps markers, though these have a white Star of David in the middle of them.

Screen shot 2014-10-27 at 12.29.49 AM

Virtual Shtetl has used Google Maps as a template and has customized aspects of its aesthetic, programming and imposing various aspects of Jewish history onto a widely accepted map of Poland. It is the user who chooses which layers of Jewishness to impose onto the map of Poland in the “Objects” tab of the map interface, selecting from different options grouped under the headings “Information about the town”, “Jewish community before 1989” (the year when communism fell), “Heritage Sites”, “Town today” and “Sources”. The options for marking this virtual map include labels such as “Cemeteries”, “Education and culture”, “Trade, industry, services,” “Synagogues, prayer houses and others”, and “Sites of Martyrdom”, allowing the user to choose what aspects of Jewish life they wish to uncover, remember, focus in on, or ignore.

Screen shot 2014-10-27 at 12.06.53 AM

These customized icons and layers change the way that the viewer reads the generic, widely-accepted map of Poland: it is no longer Google Maps as one might view it from the regular Google browser, it is Google Maps with layers of Jewishness transposed onto it. In fact, this virtual map of Jewish Poland figuratively, or perhaps virtually, colours outside the lines: Jewish sites that are no longer a part of Poland, sites that are now in Ukraine, Lithuania, Belarus and Russia are also marked with synagogues, cemeteries, and the like, showing a discrepancy between what the project considers to be “Jewish Poland” and the generally accepted boundary of Poland. Virtual Shtetl reaches beyond the boundaries drawn by Google Maps.

As a literary scholar, I can use Virtual Shtetl as a research tool to see what is left of, for example, someone like I.L. Peretz’s hometown of Zamość. Using the various filters, I can search for synagogues, cemeteries, schools and other Jewish organizations and discover whether or not they still exist. I would not have to travel all the way to Poland to discover what parts of Peretz’s Zamość are left, I could simply swoop into street view to consider whether or not it might be worth travelling to in person.

As a genealogical researcher, I can look up the small town my grandmother grew up in and see whether or not there was a synagogue in the town before the war when she was a little girl to consider how religious my family may have been before the war. I can search for cemeteries in the area where forgotten relatives might be buried. If, for example, there wasn’t a synagogue or a cemetery listed for the town, I could zoom out and find the synagogues and cemeteries listed in neighbouring towns and figure out which would have been most convenient for my family to travel to. Instead of jumping in the car and dragging my aunt around the hilly Polish countryside for a day, I can now decipher whether or not a particular site is worth visiting, whether or not it is open to the public, and exactly what is known about it before I get there. Though aspects of visiting such a site in person are arguably just as important as finding the site and discovering its history—for example interactions with the locals, the bumpy car ride, the fresh cherries, the ice cream breaks and spending time with my aunt and hearing her stories—are missing when using Virtual Shtetl, the map function of the website is still an overwhelmingly practical tool, even with its limitations. It is a great place to start one’s research and a great place to share one’s discoveries even though not every Jewish place in Poland is accounted for and not every road in Poland is virtualized by Google Earth.

In J.B. Harley’s article “Deconstructing the Map”, he urges his readers to read maps not as aesthetic objects, but as “cultural text” (Harley 7). A map like Virtual Shtetl is nearly impossible to read as anything other than a rich cultural text which reveals the social implications of not only the Holocaust and practices of postmemory, but also the cultural complexity of creating such an object. In her article Museum as Memoryscape: The Virtual Shtetl of the Museum of the History of the Polish Jews, Pauline Sliwinski notes that, “According to the website’s Google analytics, from the site’s launching on June 16, 2009 until May 31, 2010, there were a total of 299,735 visitors to the site. 82 percent of users [were] from Poland; 6 percent from the United States; 2 percent from Germany; 2 percent from Israel and 2 percent from the United Kingdom” (Sliwinski). These statistics point to the fact that the website is predominantly used by Polish users, an important statistic as it challenges many stereotypes assumed about post-Holocaust Poland. In fact, the museum that backs this project is one of a handful of Jewish establishments supported by the Polish government: “The Polish government has made a programmatic effort to change the country’s image in the eyes of the Jewish world, through diplomacy and artistic and cultural collaborations” (Lehrer 202). Reconnecting Poland with its Jewish roots is on the national agenda, it is no longer a small grassroots movement. Sliwinski goes on to note that it is possible that the “virtual” aspect of Virtual Shtetl could influence how users feel about dealing with such rich and loaded historical material: “Through this medium the differences between Poles and Jews are given less importance than their similarities and common interest in preserving the memory of the vanished cultural and physical landscapes in which Jews were a significant part” (Sliwinski). The user, in other words, does not have to deal with the cultural implications of physically entering into a space that could be potentially confrontational or emotionally uprooting, but rather the user is allowed control of their experience in the privacy of their own home. In this virtual space, the user is free to be guided strictly by their own curiosity and personal interests, rather than being restricted by the way that a space is curated in a museum exhibition or by the boundaries that social conventions impose.

Effectively this project reveals that Poland itself is in a state of postmemory. Marianne Hirsch describes “postmemory” as “the relationship that the ‘generation after’ bears to the personal, collective, and cultural trauma of those who came before—to experiences they ‘remember’ only by means of the stories, images, and behaviors among which they grew up” (Hirsch 5). Virtual Shtetl is a collective memorial act created by the “generation[s that came] after” the Holocaust in Poland. “These events happened in the past, but their effects continue into the present” (Hirsch 5), writes Hirsch. A project like Virtual Shtetl is evidence of the continuing effects of the Holocaust in Poland in its custodial goals, including the documentation of Poland’s Jewish cemeteries and goals of mapping these sacred places out on Google Maps as well. Upon the unveiling of the Museum of the History of the Polish Jews’ core exhibit, Piotr Wislicki, the chairman of the Jewish Historical Institute of Poland, recently stated that, “There is no history of Jews without Poland[, a]nd there is no history of Poland without Jews” (Lyman). The intertwined history of the Poles and the Jews was wiped away by the Holocaust, forcing both groups to forget one another for a period of time, and now, after the fall of communism, both groups are slowly beginning to rebuild the memories that were lost, forgotten, or destroyed.  Bernhard Siegert, in his article “The map is the territory”, writes, “A main feature of the analysis of maps as cultural technologies is that it considers maps not as representations of space but as spaces of representation” (Siegert 13). Through the space of maps, a space for the representation of what was lost to Poland during the Holocaust is found in Vitrual Shtetl.


Works Cited:

Harley, Jacob. “Deconstructing the Map.” Cartographica 26.2, Summer 1989. Pgs 1-20. Print.

Hirsch, Marianne. The Generation of Postmemory: Writing and Visual Culture After the Holocaust. New York: Columbia University Press, 2012. Print.

Lehrer, Erica. Jewish Poland Revisited: Heritage Tourism in Unquiet Places. Bloomington & Indianapolis: Indiana University Press, 2013. Print.

Lyman, Rick. “To Celebrate Its Jewish History, Poland Presents ‘a Museum of Life’: Museum of the History of the Polish Jews to Unveil Core Exhibition.” New York Times. October 21, 2014. Web. October 26, 2014.

Museum of the History of the Polish Jews. Virtual Shtetl. Web. October 26, 2014. 

— “Virtual Shtetl Portal—Wirtualny Sztetl.” July 3, 2009. Facebook. October 26, 2014.

Siegert, Bernhard. “The map is the territory.” Radical Philosophy 169, September/October 2011. Pgs 13-16. Print.

Sliwinski, Pauline. “Museum as Memoryscape: The Virtual Shtetl Portal of the Museum of the History of the Polish Jews.” Museums and the Web 2012. April 7, 2012. Web. October 20, 2014. 

Posted on 2014/10/26 by

Google Maps as a Politic: A Conversation Between Aline & Lizy

This is our attempt to recreate the dialogue we have had while developing our Maps Boot Camp exercise. We recognized that the differences in our knowledge, personal, and academic practices/experiences would help, rather than hinder, our collaboration.

“Discussion is an exchange of knowledge; an argument an exchange of ignorance.”

– Robert Quillen

Rather than one of us attempting to write for us both, or to co-write, we agreed to write much of our Boot Camp exercise write-up as a conversation. We sat down on a Sunday afternoon with our notes and began collaborating in Google Drive on a document on which we could work simultaneously while being able to see what the other person was writing/editing. Here’s the sum of our conversations, more or less:

Lizy Mostowski: I think that we should talk about Google Maps. 

Aline Lemay: Perhaps. What about the other programs Darren mentioned in the syllabus?

LM: Do we know how to use the other applications?

AL: What about something like StoryMaps? MapBox and ZeeMaps seem to be more about visualizing information to present and share–communication and aesthetics.

LM: Let’s see. [Goes to StoryMaps website.]

AL: The thing with Google Maps is that it doesn’t really seem to include a mechanism to integrate narratives.

LM: I disagree. Look. [Creates a map in Google Maps and marks a location.] You can mark a point on the map and type up a brief description of the place.

AL: I’m more interested in the narrative of the places, the stories. What about a beginning, middle, end–more or less? A journey.

LM: I think you can link up the points that you map on Google Maps.

AL: Are you sure? And how?

LM: No. But look at this website. [Goes to Museum of Jewish Montreal’s website.] These walking tours are made in Google Maps. They use Google Maps as a template.

AL: When I worked on the history gallery of the National Museum of Singapore, our exhibition design team explored Sound Walks because the exhibition content needed to be in a minimum of four languages, as we were developing a hand-held audio guide as multilingual labels are not so visitor-friendly. I wrote the scenario for the history gallery; listening to sound walks helped me create a prototype for the designers as we needed to test the audio experience to understand how soundscapes and storytellers could communicate the narrative of the nation in the theatrical settings surrounding the collections.

One of the sound walks we used was “Manhattan: Ground Zero”, narrated by Paul Auster, 2004. The website shows a map of the walking route, and describes the tour.

Screenshot from: http://www.soundwalk.com/#/TOURS/groundzero/

Screenshots from: http://www.soundwalk.com/#/TOURS/groundzero/

(Screenshots from: http://www.soundwalk.com/#/TOURS/groundzero/)

Available online for $1 USD, the tour attempts to recreate the intimate experience of a guided tour (pace is the sound of footsteps) at a fraction of the cost, with the advantage of an authentic and rich soundtrack. The audio has the authority of a specific guide and authentic media. I’ve never used it in New York. 

LM: I think that in relation to our project, looking at Google Maps will be the most useful. The Museum of Jewish Montreal uses Google Maps as a template. The museum is a virtual one: it does not have a physical space, its exhibits do not occupy the rooms of a building. Their exhibits are displayed online, where a visitor can experience them either from the comfort of their own home, or directly in the streets of Montreal, whenever is convenient for them, and at no cost.

Screenshot from: http://imjm.ca/work

(Screenshot from: http://imjm.ca/work)

The museum has only recently begun giving guided tours (for a small fee, at a set time, with an actual tour guide) which are focused in the Plateau neighbourhood of Montreal. Last summer the executive director of the museum, Zev Moses and I began talking about potentially creating a tour of Montreal’s Jewish literary scene. In these initial conversations, I sent Zev a prototype of a potential walking tour that I mapped out in Google Maps. In light of this workshop, I contacted Zev and asked him why exactly the museum chose to use Google Maps as a template on their website and not any other map application.  Here’s a bit of what he had to say:

When the project was originally conceived in 2009-2010, map-based digital history was still kind of rare. […] In fact, Mapquest was still more popular than Google Maps through part of 2009! Not knowing much about web development and user experience online, I originally planned to design our own maps from AutoCAD files. A consultation with a developer made me realize that using a Google Maps API on our website would be way easier to code and update. When you run a website, it quickly becomes an imperative to give users the easiest and smoothest experience so that they spend longer on your site and visit again. This is even important in the realm of research and non-profits – we have to show metrics to prove to funders that people are using our site and that we are worth funding. Using a familiar interface like Google Maps therefore made the most sense, despite its biases and limitations. Since we came online in 2011, both Bing and Apple maps have come to compete with Google Maps and I have heard that Apple Maps is now more popular with some mobile users. As almost 30% of our users are now on mobile (versus just 18% one year ago), we may need to consider switching APIs at some point. So perhaps we may end up replacing Google Maps in the end. (Moses)

Google Maps is used for a variety of things by the everyday user, predominantly figuring out where they’re going. From your smartphone you can easily type in an address and get driving, cycling, walking or public transit directions through Google Maps that are reasonably reliable. Much more reliable than Apple’s maps, in my opinion, anyway.

AL: I have absolutely no sense of direction, driving in Alberta and walking in Montreal, and cities I’ve visited. I ask for directions. But we did travel before cell phones with Google Maps. The authenticity of the map depends on the authority of the speaker. Tour guides whose lives are part of the narrative are much more engaging because there is a personal connection with the audience: shared experiences, comments and questions about specific features of the mapped area and connections with out-of-bounds areas and past events. The audience recognizes when their guide is someone working from a memorized script written by someone else. Believability is diminished.

LM: I completely agree. I think that what Zev said about Google Maps having “biases and limitations” is interesting–when a tour is online, it seems that the map, in this case Google Maps, has to carry the authority that a tour guide would otherwise have.

AL: Yes, this is exactly what every museum exhibition is attempting to do – the experience of a personal guided tour.

LM: Google Maps is a template, not a blank page as we may assume, but rather it is more like a formatted blank document offered by Microsoft Word. However, Google Maps is not as basic a template as we assume.  Google Maps, the universal tool that remembers your home address and that knows you by your email address seems as unbiased an application as any, however, like just like any other map or corporate organization, it is influenced by politics.

AL: A template? That’s not quite my understanding of the word “template” in the computer world. I understand it as a predesigned electronic formatted structure to fill in, like a letter, fax, report, spreadsheet. But I do see it as a tool that shapes the content, not a template.

LM: Exactly. Just like templates on Microsoft Word, because of the inherent biases of Google Maps, it likewise shapes the content a user plugs into the map. In an article called “Disputed Territories” the author shows the reader twelve different geographic locations in the contemporary world where the border lines are disputed and where these disputed borders are drawn differently on Google Maps designed for different countries, which, obviously, each have their own sets of assumptions about the border. The most familiar example (at least to a Western audience) that the author cites is Crimea: from the United States you will see Crimea sectioned off from Ukraine by a dotted line, from Russia that line becomes solid, from Ukraine’s perspective there is no line at all.

 Screenshot: http://opennews.kzhu.io/map-disputes/

(Screenshot from: http://opennews.kzhu.io/map-disputes/)

Simply stated, if you are accessing Google Maps from Canada, your map of the globe will be different from that of people accessing presumably the same map from Russia, Ukraine, and China, for example. This perhaps proves Bernhard Siegert’s statement that, “maps contain less information about a territory than about the way it is observed and described” (Siegert 13). Google Maps is playing it, as my dad would say, “politically correct” by showing a country the map of the world or of their territory as they understand it or know it to be. However, Google Maps is playing it so politically correct that it allows one to question its reliability. Google Maps is playing both sides of the fence. As an app that many of us use daily and rely on, not only as a template for projects but also as a map to get us from point A to point B, we expect it to show us the right map. This discrepancy makes one question whether Google Maps is showing us the true map or the map that we want to see. Google Maps as a politic: How are maps influenced by our beliefs? Can we use Google Maps as a template for our projects if it carries its own biases? How are these biases transferred onto our projects?

AL: I have questions about the uses of Google Maps as a tool. Isn’t it as J. B. Harley wrote in “Deconstructing the Map”, that it is “a cold thing, a map, humourless and dull” (Harley 1)? How will a digital tool enliven it? It seemed we were both just as curious about mapping as a verb, as we were about maps as a noun.

LM: Yeah. The act and the process of mapping is just as interesting as the artifact it can produce.

AL: My own, limited museum exhibition experience with maps is choosing to include them as informal learning components for certain exhibitions, but unless the map is deemed a significant component of the exhibition storyline, it will only appear in a corner, not on the main path.

LM: That’s interesting, when I think of a tour or accessing a scene from a novel, I think of geography as a point of access, not as something that is off the main path in the corner.

AL: For the “Empress of Ireland” exhibit, the immigration route – by sea and rail – was communicated with a large, colourful table-top map on which museum visitors – children – could move wooden trains and boats to travel the routes of immigration from Europe to western Canada in 1914. For the exhibition, territory was combined with how immigrants travelled. So the map informed not only geographical locations and proximities, but the voyage. Quotes from Rudyard Kipling’s writing about his shipboard experience, including the wireless shack, were positioned along the main exhibition path of “Empress of Ireland”. How is the amount of time required to travel from one location to the next, via specific modes of transportation and distances, part of a digital map?

LM: That’s what makes Google Maps so captivating as a tool. Not only can you create a map in Google Maps, not only can you virtually stroll the streets in Street View, you can use it to suggest a route, to estimate travel time.

AL: In addition to “Disputed Territories”, I searched for TED Talks about mapping. An application of Google Maps is Google Map Maker. Here is what I found:

LM: Google Map Maker is like the map version of Wikipedia, except without the obligatory footnote: anyone from around the world can use their memory or knowledge of a place to help map it further. 

AL: I was particularly taken with Lalitesh Katragadda’s TED Talk: ‘Making maps to fight disaster, build economies’ that showed how this application could help save lives by providing the tools to the locals, who have the lived experience and knowledge to map their own land. I grew up on a farm and know that local farmers, like my dad and brother, understand the land and weather patterns as well as external ‘experts’.

LM: When a cyclone hit his hometown, Katragadda points out that without a map, it was impossible for relief to get to the victims of the natural disaster. Katragadda cites a shocking statistic—that as of 2005, only 15% of the world was mapped (Katragadda). By using Google Map Maker as a tool, locals were able to map the devastated locations for relief workers to be able to access the area.

AL: In “The Circulatory Turn,” Will Straw writes, “The transformation of variable behaviour into stable structures is evident in the more banal ways in which digital communication interfaces stabilize shifting relations of distance and mobility between people” (Straw 19). The stability and banality of Google Maps is valuable within the context of a natural disaster, but what else can Google Maps do?

LM: Google Maps is the cause of new social phenomena. Going back to the Street View perspective of the application, one can, for the first time in a digital format, use Google Earth and Street View to retrace their steps through visual memory. There is no other application that can create a story like this one:

Saroo Brierley’s story is used here is an advertisement for Google Maps and Google Earth. His story shows a new application to the global online map application: one can find a location not based on GPS coordinates, an address, or even a town, but rather one can find a location based on visual memory. In Katragadda’s TED Talk and in Brierley’s personal history we have two phenomena showing what this politically correct, corporate tool can do to change the world and our relationship with it. 

AL: Google Maps is more than a ‘cold’ thing if a boy’s visual memory – growing up with a map on the wall and retracing his steps on Google Earth by following train tracks – can reunite him with his family.  A tool with an intriguing mechanism of place and memory is murmur. Icons are posted in neighbourbood locations, and people call with their mobile phone to hear oral histories about the geographic location they’re in. It was first established in Toronto’s Kensington Market in 2003.

LM: Speaking of Kensington Market, working on this project and thinking about Google Maps as a tool has made me wonder about how Google Maps can be used as a research tool, specifically how I could apply this knowledge to my MRP, if it would even make sense to complicate my MRP further, and whether or not I should present the class with a working prototype of my MRP geographically mapped out. I then realized that I’d asked my supervisor to buy me a map of Israel when she visited last summer, acknowledging that it would be helpful to my writing process to visualize the locations one of the authors I am working on was describing in his memoir. And now that I really think about it, I’d also asked, a few months before that, for another professor visiting Poland to get me a map when he went there as well, claiming that I felt I needed a visual of Poland when I wrote. So clearly, maps are very important to my thinking process when I’m writing, but how can I use them as a research tool?

Of course, before putting maps of Poland and Israel on the wall in my living room around my desk, I asked my roommate if she would be okay with it. I realize what Harley is pointing to in his article: that there simply is no map that isn’t political. Even if I am studying with the map, hanging the map on my wall, or just looking at the map, I am engaging with it in a very political way. I also realize how helpful geography is to my thinking about the two memoirs I am studying—at different points in each memoir both authors are describing Toronto’s Kensington Market. Their separate lenses on the same physical space are entirely different as both authors lived in the neighbourhood, though decades apart. One author’s relationship with the neighbourhood shows her closeness to the Holocaust—her experience was of Yiddishkeit when the area was predominantly populated by Jews directly from Eastern Europe, while the other author’s experience was more contemporary—reflecting the neighbourhood’s cultural diversity and the author’s struggle for satisfying his nostalgia for an Eastern European Jewish atmosphere he never experienced firsthand. Finding where these two authors meet geographically was poignant for me to realize simultaneously their closeness and their distance, and forcing me to define just what that was.

AL: So to our class activity…

AL & LM: What does it mean to map a fictional narrative onto a “real” map?  We realized in our thinking that there are three different layers of geographic location in a typical narrative: concrete location (an actual address is stated in the narrative), general location (a landmark, neighbourhood, city, region or country is named), and referential location (a place can be located by visual knowledge of the geography). How do these different layers of geography inform one’s reading of a narrative? How does one’s familiarity with a place texture their experience of the place in a narrative? How do issues like distance between settings in a story inform the narrative? Why does an author use specific locations to geographically situate a narrative, leaving certain locations concretely located while leaving other locations vaguely located?

LM: I think another aspect to consider when mapping literature is curation. Which locations are you choosing to include when mapping a narrative? Which locations are you choosing to omit? Why? I think that something Zev Moses said in that same email he sent me is pertinent to thinking about this issue: “We try to tell a logical story to our users that teaches them about a broader theme, while also making sure they can walk the tour in a somewhat linear fashion and in a fairly reasonable amount of time” (Moses). Geography, Moses reveals, informs the curation process, as a tour needs to function in real time and space. He mentions the digital exhibition, Work Upon Arrival, to show how fifteen oral histories were narrowed down to just six because of their geographic locations:

Ultimately, through an iterative process that combined creating a narrative of a generic immigrant’s experience (from arrival, to finding work, to working conditions, to unionizing and striking), along with making sure the geographic area of these experiences was somewhat confined and didn’t take the user in circles, we decided to place the tour/digital exhibition along Ste-Catherine. But what we lost in breadth actually created a really compact and legible tour that I think can give anyone a good sense of Montreal’s Jewish immigrant and labour experience in the early 20th century. (Moses)

How can we apply this knowledge of tour/exhibition curation to using Google Maps as a research tool to apply to literature?


Works Cited:

“Disputed Territories.” Open News. Web. October 26, 2014. 

Harley, Jacob. “Deconstructing the Map.” Cartographica 26.2. Summer 1989. Print. 1-20.

“Lalitesh Katragadda: Making Maps to Fight Disaster, Build Economies.” January 13, 2010. TED Talks Channel. YouTube. Web. October 26, 2014. 

“Manhattan: Ground Zero.” SoundWalks. Web. October 26, 2014. 

Moses, Zev. “Quick Question.” Message to Lizy Mostowski. October 25, 2014. Email.

“Saroo Brierley: Homeward Bound.” October 15, 2013. Google Maps Channel.YouTube. Web. October 26, 2014.

Siegert, Bernhard. “The map is the territory.” Radical Philosophy 169: September/October, 2011. Print. 13-16.

Straw, Will. “The Circulatory Turn.” In The Wireless Spectrum:  The Politics, Practices and Poetics of Mobile Media.    Editors: Barbara Crow, Michael Longford, Kim Sawchuk. Toronto: University of Toronto Press, 2010, pp. 17-28.

“Work Upon Arrival.” Museum of Jewish Montreal. 2013. Web. October 26, 2014.

Posted on 2014/10/23 by

Labanotation: The Topology of the Moving Body

“In its diagrammatic nature, topology is a persistent encounter with the shape of language. In moving from the haptic totality of the book to the visual totality of the diagram, topology allows us to reengage with the notion of the textual corpus–as a body in space whose surfaces and contours have meaning. In place of the book’s geometric continuity…topology marks an entry into a textual universe of far greater formal and structural diversity. In returning us to the question of form, topology is also a figurology” (Piper 390).

This quote by Andrew Piper in “Reading’s Refrain: From Bibliography to Topology,” made me think about the text as a three dimensional “body in space” and the varied shapes and “structural diversity” that this concept of the text can illuminate. Both Piper and Franco Moretti take up literature as their object from which to create a topology, but I began to wonder whether this type of diagrammatic approach would be possible with any other type of art. Of course, I always seem to return to dance and performance, and as soon as I began to think about actual bodies in space and the alternative ways they might be recorded or dissected, I remembered the geometrical notation of Laban Movement Analysis.

Rudolf Laban (1879-1958) was a Hungarian dance artist and theorist and a pioneer of modern dance in Europe. He developed Labanotation in 1928 as a means of archival notation and movement analysis, and it is used to this day, even in the development of robotics and human movement simulation. Labanotation uses abstract symbols to define:

Direction and Level of Movement

The static shape is a rectangle, denoting no movement. It is adapted to demonstrate the eight directions: forward, back, side left, side right and the four diagonals. The shading within the shape signifies whether the level of the movement is low, middle or high. 

figure A

Parts of the Moving Body 

The shapes are arranged on a vertical staff to indicate which part of the body is moving. The center line of the staff represents the center line of the body. Symbols situated on the right represent the right side of the body and likewise for the left.

labanotation2

Duration of Movement

The staff is read from bottom to top and the measure is marked by bar lines. The length of the shape/symbol on the staff denotes the duration of the movement. Weight transfer, spatial distance, spatial relations, turns, particular body paths and floor plans are all notated by specific symbols. Jumps are indicated by an absence of symbol, which shows that no part of the body is supported or in contact with the floor.

figure B

Dynamics of Movement

Effort symbols are used to indicate an increase or decrease in movement energy. The four categories of quality are:

Space: Direct / Indirect

Weight: Strong / Light

Time: Sudden / Sustained

Flow: Bound / Free

figure 48

glide float press - movement

Labanotation not only provided a new way to record movement that would help keep traditional choreography alive and well, but also changed the way we think about dance. Laban successfully liberated dance from the formal constraints of music, narrative, steps and “technique,” focusing instead on the basic shapes and directions of a body in motion.

Laban saw that dance had evolved in a flat space, limited by the space of the theatre and other spaces of performance, and wished to restore depth to dance.

cartesian vs icosahedral net

He used the icosahedron to indicate a volume of multiple directions, thus freeing dance from the flatness of the stage.

within shape

Laban also separated dance from its entanglement with music–movement for Lacan did not pander to an outside source of melody, rhythm or meter but rather could be sudden or sustained, direct or flexible, light or strong, depending on the impulse from within the dancer’s body. By freeing dance from music, Laban also freed it from time.

In relation to weight, Laban realized that body movements couldn’t be isolated from the flow of weight in the body and that “for every muscular contraction there was a relaxation,” yet by freezing the body at different points in its trajectory, using photography, 3D modeling, drawing or mapping, Laban was able to identify where the subtle shifting of weight began (as an impulse) and receded.

The “Kinesphere” is the Laban Movement Analysis term for the zone of possible movement of a human subject:

kinesphere - zone of possible movement for human subject

In “Laban’s Choreosophical Model: Movement Visualization Analysis and the Graphic Media Approach to Dance Studies,” Nicolas Salazar Sutil explores the influence Rudolf Laban has had on the way we understand human motion as a collection of fixed points in a movement continuum. Sutil writes “Whilst intuition knows the movement from within as a continuous whole traversing space, an analytical eye encourages us to think of movement and rationalise it as a series of immobile divisions. This breakdown of movement into units” effectively “seizes the continuous flux of movement” (148).

This topological approach is essential to the theoretical study of movement, because when “this meaningless flow becomes identifiable as a fixed object of analysis,” it also becomes “an object for documentation and reconstruction” (148). As Laban puts it, “we consider our snapshots separately only for the sake of analyzing the characteristics of the whole flux” (qtd. in Sutil 148).

Andrew Piper’s conception of textual and literary topology encourages us to consider reading a “deeply visual experience” and to “think about language as a form of action rather than expression” or that “which can be mapped and seen” (387, 377). Likewise, methods of drawing and kinetographic inscription such as Labanotation highlight the activity of dance, rather than its expressionism. Laban’s topography serves the purpose of analytical examination and provides a record of movement that can extract from a random flux of motion a series of basic units within which to construct ordered sequences and patterns (Sutil 148).

Piper writes that “the topology itself is largely metaphorical….Unlike the pages of a book, which can never be observed all at the same time…the topology allows visual access to a textual corpus in its entirety. It replaces the haptic totality of the book with the visual totality of the diagram” (388).

Likewise, whereas individual body positions in dance can never be observed all at once since the body is in constant motion through space, Laban’s notation allows some sense of “visual access to a textual corpus in its entirety” by way of mapping corporeal tendencies in space that span across different bodies, places and temporalities (Piper 388). Laban’s achievement in the formal conceptualization the dancing body is not unlike Franco Moretti’s statement on what graphs and maps can reveal about literature: “Form is precisely the repeatable element of literature: what returns fundamentally unchanged over many cases and many years” (225). These types of approaches are thus shown to reveal, not only the architectural “scaffolding” that lies at the core of a work of literature or a piece of choreography or movement, but also we see how topology can be a useful tool for understanding history, legacy and heritage. Laban’s notation made it possible to record movement on the page, increasing accessibility to choreography and eliminating the human agent who would need to teach said choreography to the dancers of the future. But Laban also changed the way we think about the body in general.

By using the Platonic shape of the icosahedron to demonstrate the capabilities of human movement, Laban invented a somatic mathematization that is both organic and yet also void of the human. Sutil notes this hybridity: “What is remarkably contemporary about Laban’s writings is that they present this relationship between body and ideal space not in a strictly Pythagorean or Platonic sense, that is, not from the point of view of a metaphysical and totally bodiless agency. The Platonic solids are not mathematical objects, they are real-life models of harmonic movement” (161).

There are many similarities between Labanotation and the topological methods that Piper and Moretti offer. These types of methods change how we think about narrative expression, but they also offer a new way of thinking about the text or the object of dissection. Just as Christian Bök’s experiment with Jekyll and Hyde in Already Bad Enough When the Name Is But a Name offers us a new way to visualize the way these characters interact within the text (using a statistical analysis of Stevenson’s use of their names), so too might Labanotation offer a new way to read the narrative of Swan Lake, for example. The difference between the literary and the dance object in these experiments is that whereas literature is produced by a human, once it is on the page, it becomes its own object worthy of analysis. Dance, on the other hand, is inseparable from the human body. The dancer’s body is both canvas and paintbrush, and the production of dance art hinges upon movement as a tactile and experiential sense.

How can the dancer’s agency or subjectivity be accounted for in diagrammatic methods of distant reading such as Laban Movement Analysis? And how does something like Labanotation change the way we think about the body? Is dance even possible without a body, or without multiple limbs or range of motion? These are questions that have arisen and will continue to interest me throughout this exploration.

Works Cited

Moretti, Franco. “The Slaughterhouse of Literature.” MLQ: Modern Language Quarterly 6.1 (March 2000): 207-227.

Piper, Andrew. “Reading’s Refrain: From Bibliography to Topology.” English LIterary History 80 (2013): 373-399.

Sutil, Nicolas Salazar. “Laban’s Choreosophical Model: Movement Visualization Analysis and the Graphic Media Approach to Dance Studies.” Dance Research 30.2 (2013). 147-168.

Posted on 2014/10/22 by

Interacting with Print – The Multigraph

Interacting with Print is an interdisciplinary, inter-institutional research group devoted to the study of European print culture in the period 1700-1900. IwP is nearly ten years old, and has members and collaborators from McGill, Concordia, the Université de Montréal, Stanford, the University of Toronto, Simon Fraser University, the University College of London, the University of Edinburgh, and the University of Virginia, from different departments such as English, History, German, and Modern Languages. This collaborative approach enables them to “build a solid understanding of the cultures of print in a way that disaggregated studies could not… Interactivity is both the group’s topic and method: in order to study the interactions of the past, IwP creates new kinds of interaction in the present” (interactingwithprint.org).

The group’s primary goal is to use interactivity as a lens through which they examine print culture and media history. They are interested in how people interacted with printed materials, how they interacted through these printed materials to communicate and interact with each other, and how  “printed texts and images interacted within complex media ecologies.” Interactivity is the key to their investigation: “‘Interactive’ is a word most often associated with digital technologies, but we contend that a nuanced and historicized concept of interactivity is key to developing a deeper understanding of print, which emerged as the predominant communications technology in Europe in the period 1700-1900″ (IwP).

The Multigraph

Jonathan Sachs approached me to work on the Multigraph, an innovative collaborative book project, in June. He explained that the project is a direct extension of the group’s goal to change current conceptions of print media. The plan was for the book to address “the variety of cultural practices of intermediality prevalent in Europe in the eighteenth and nineteenth centuries,” and to “investigate how individuals interacted with printed matter, how they used print to interact with each other, and how print itself interacted with other influential media from the period, such as handwriting, illustration, sculpture, the theatre, musical performance, public readings, and polite conversation” (IwP). By examining this sort of interaction, the multigraph aims to provide readers with a “systematic overview of key concepts for the study of this vital period of media transition, from print’s emergence as the predominant communications technology in Europe until the onset of electronic media in the twentieth century” (IwP).

The Methodology

Among the contributors, this project is nearly always discussed using organic metaphors. While the structure of the multigraph may at first seem like the Exquisite Corpse game, the transparency of the process makes it much more like growing a garden. There are three phases – seeding, grafting, and pressing, and they correspond rather elegantly to spring, summer, and fall, or planting, tending, and harvest.

In the seeding stage, participants were asked to offer brief contributions on a key concept for the volume from any area of their own research. The seed had to be generative, so as to motivate further additions from other contributors: “The ideal seed is one that can grow in several directions. It encourages the contributors to think about the openness of research questions.” The digital seedbed contains nineteen seeds now, and it is quite different from the initial set of seeds; like any organic matter, any seeds that did not thrive in the growth phase simply died, or had to be pruned.

images-5

During the grafting stage, authors were expected to expand on at least two other authors’  seeds by about 500-1000 words per graft, but they could also contribute in any way to any of the available seeds. As in any good garden, the point of the graft was that it must take – it required consideration of the ideas of another and an attempt to draw connections with thoughts that are not one’s own. In order for a graft to survive, and to promote subsequent grafts, it had to integrate well.

images-4 images-3

The pressing stage is concerned with the fixation of the project into a stable form, to shift from the vitality of the web to the more permanent form of the hortus siccus, the specimen book of pressed flowers. Authors took on the role of editors, in this phase, and began to prune and refine the seeds into a finished product. Each author was responsible for editing his or her own seed, but any author could edit any part of the multigraph. One of the most interesting and indeed collaborative aspects of the project is that, in this phase, there was absolutely no hierarchy between the authors and the editors.


images-6

The multigraph is, at its core, an experiment in changing the way scholars think and write about print culture and the history of media. It is particularly interesting that the platform IwP is using to perform this experiment is a digital one. We use a private, password-protected Wiki, but it functions quite like the Wikipedia we are all familiar with. Anyone can create a page (the “seeds”), anyone can add anything to any page, and anyone can edit. There is no visible indication of the authorship, although administrators can access that information.

For a project that is so deeply concerned with print as a form, the choice to use this format for the writing is significant. It changes the nature of the text because it transforms the author(ial)ity of the writing. The goal of the multigraph is, at its core, to “draw on the interactions of both digital and print media, ultimately taking the form of a printed book, but one whose creation utilizes the collaborative tools of online communication” (IwP), however, that very collaboration causes some unexpected effects.

Collaboration is a fairly rare thing to see in academia. The reason for this is that collaboration and authorship exist on a plane of inverse proportions. The more collaborative a work is, the more nebulous the authorship becomes. This is a problem for scholars because their value is determined by how much they publish. The tired old “publish or perish” still rings true, and only gets harder to do as the world becomes increasingly digital. Kathleen Fitzpatrick’s book Planned Obsolescence addresses this issue:

“Academic institutions are facing a crisis in scholarly publishing at multiple levels: presses are stressed as never before, library budgets are squeezed, faculty are having difficulty publishing their work, and promotion and tenure committees are facing a range of new ways of working without a clear sense of how to understand and evaluate them.”  (Fitzpatrick)

When we consider this project and the people who have produced it, it seems only logical that this sort of work would emerge as their final product. It is also easy to imagine how this format could be adapted and applied to any number of projects in any number of fields, and yield all kinds of fruitful discourse. However, with Fitzpatrick’s point in mind, we can see the difficulties it may encounter as it gains the momentum it will need to become more than an interesting and unique prototype. In this sense, the multigraph is an experiment that might never have been conducted, were it not for this group who has interactivity as both their topic and their method.

Ultimately, the goal is to publish this multigraph as a book. Publication is the teleology of all academic writing, and this book is no different – except that it is entirely different. Its form will be the same as most other books, but there’s a blurring in the content that emerges from its unusual authorship, which is part of the multigraph’s purpose: to reduce “author function,” as Foucault would see it, and to make this a print object that is uniquely concerned with print. This project is something of a unicorn, however, because unlike most academic writing, the group made the conscious choice to “move in a different direction than the academy’s increasing over-reliance on measures of accountability, in which, unable to measure what we value most, we have come to value what we can measure. Effacing the acute measurability of academic work is a first step in moving past the absurd — and in our view deleterious — tendency towards quantifying the assessment of learning and research today. It is time to develop new models of creativity and thought that are not easily subsumed within the accountant’s black arts. This project intends to affirm the argument that when it comes to the making of ideas the whole is always greater than the sum of the parts” (IwP).

Works Cited

Interactingwithprint.org

Fitzpatrick, Kathleen. Planned Obsolescence: Publishing, Technology, and the Future of the Academy. New York: New York University Press, 2011. Web.

Foucault, Michel. What Is An Author? Trans. Josué V. Harari. Movement Research. 22 February 1969. Web. 22 October 2014. http://www.movementresearch.org/classesworkshops/melt/Foucault_WhatIsAnAuthor.pdf

Aristotle. Poetics. Trans. S. H. Butcher. The Internet Classics Archive. Web Atomic and Massachusetts Institute of Technology, 13 Sept. 2007. Web. 4 Nov. 2008. ‹http://classics.mit.edu/›.

Posted on 2014/10/21 by

From diagram to cryptogram, and the future of sense-making in the humanities

Last April, Toronto Star editor Jordan Himelfarb stumbled upon and eventually cracked the case of the Weldon code. According to Himelfarb’s research, a total of 20 coded messages have been uncovered between the pages of books at Western University’s Weldon Library over the course of the last two years, with each note, printed in a custom alphabet, accompanied by a physical item/trinket and the image of a household object, and stamped with the URL to a dead-end blog (000xyz.blog.ca).

Weldon code

Example of cryptic note found at Western

It took Himelfarb less than a week to solve a mystery that for months confounded the Internet, one obsessive economist, a good-humoured Egyptologist, an enthusiastic library security guard, and a handful of (bored?) linguists and cryptographers. A simple Google search of the 000xyz blog owner’s username, “Sculpture 2.0,” turned up information about an art movement known as social sculpture, putting Himelfarb on the trail of one Kelly Jazvac who had previously taught at Western. The meeting with Jazvac revealed the notes to be part of an art project, the imaginative work of an undergraduate student. And ultimately, while decodable, the messages were meaningless.

1396650494172

The encryption key to the Weldon code

And yet, Himelfarb wraps up the piece with vaguely optimistic and very humanistic conclusions about his experience investigating the so-called mystery of the Weldon code:

Mike Moffatt, the Weldon security guard and I, and the still-growing group of others around the world were drawn in by these objects of rare wonder. Bound by shared curiosity, we did something essentially human: We gathered in old spaces of inquiry and created new ones, and together searched for meaning. Forget what the code of the Weldon letters says; look at the beautiful thing it did.

It’s probably safe to surmise that the “beautiful thing” Himelfarb is referring to is the strange and otherwise unlikely collective of individuals who were brought together under the spell of an unknown language and the brief alternate reality this alien form opened up within the familiar silence of the library and its graves of knowledge. And the mysterious notes did so by failing to communicate anything: by mutilating expectations of content and readability, doing something instead through the untranslatability or unsayability of their cryptic form. Plumbing the depths of the unknown and coming out the other end with tranquilizing musings about the journey but few definitive answers is indeed a very human thing to do. At the close of “The Slaughterhouse of Literature,” Moretti operates under a similar state of obstinacy in the face of a failure to reveal realities without conflating structures and processes of discovery when contemplating the tautology of his research project. Sure the methodology was flawed and incomplete (it always is) but what diagrammatic methods like the tree graph offer is the possibility to re-inscribe all the nothings, in such a way that while “literary history could be different from what it is” but isn’t and all the nothings are still nothings and the Weldon notes still mean nothing new formal constellations hint at the always-present invisible potentialities in the transition from states of multiplicity to modes of representation, even if what is brought into view are simply new territories of connection within which to consider otherwise trivial objects (227).

That’s a very Badiouian thing to say, obviously, but as Piper reminds us, namely by referencing Badiou’s ontological mathemes, a certain measure of diagrammatic and/or cryptographic literacy has always had a place in literary studies well before the rise of the digital age. Harder to forget still is how contentious the alliance between literary studies and technical/mathematical systems of logic has always been. As Alan Sokal and Jean Bricmont tried to argue in Fashionable Nonsense: Postmodern Intellectuals’ Abuse of Science (1998) the suspicion persists that literary theory’s appropriation of algebraic and now computational modes of thinking works to aesthetically legitimize the field and the value of its interpretations in the world. Then again, it took a journalist with a background in philosophy to decipher the gibberish behind a set of glyphs, to see “the significance of non-significance” of the code-breaking process and elevate a little story with the sort of mysticism that makes us want to look deeper into obscure spaces (Piper 395).

Having said that, we can consider another recent (and in this case, or thus far, annual) cryptological event that forces us to ask more serious questions about the future of sense-making in the humanities and the future of humanists poorly versed in cryptologic. The Cicada 3301 puzzles, a series of nested encryptions that usually begin with a single image, mysteriously started appearing online with the explicit intention of seeking out “intelligent individuals” with a host of specialized skills related to cryptography. Here, for example, is the twitter image that launched this year’s Cicada puzzle:

zN4h51m

And here is the code yielded after the image was stenographically processed through a program called outguess:

52b30b52c3f86

No one knows who or what is behind Cicada, nor what solving the puzzle uncovers, and while I certainly have no hope of finding any of this out there are naturally speculations that this is an elaborate recruitment game organized by security agencies. Of interest, however, is that Cicada is basically a digital onion concealed mostly in references to literature, art, and philosophy–code games instead of language games whose deep readings necessitate specialized knowledge that my recent experience working on the Dracula database taught me I do not possess. Considering the Cicada puzzles alongside the Weldon incident brings up mixed feelings about Piper’s observation (warning even) that there is an undeniable “push against the sequestration of numbers from language” (388). There is a problematic romanticization of the human project behind Himelfarb’s final insights (which is arguably also reflected in the occultist draw of the Cicada puzzle) that nonetheless reinscribes the truth-values, however inauthentic but perhaps needed, that humanist impulses bring to the table. At the same time, reminders come along that there is much more going on in the darkness and the blindness of those readings. What matters more perhaps is asking how this conversation is mutually redefining both the status of literary texts and the status of code as non-literary.

References:

Himelfarb, Jordan. “I cracked the code at the Western University library.” The Toronto Star 5 April 2014.

Moretti, Franco. “The Slaughterhouse of Literature.” MLQ: Modern Language Quarterly 61.1 (2000): 207-227.

Piper, Andrew. “Reading’s Refrain: From Bibliography to Topology.” ELH 80 (2013): 373-399.

Posted on 2014/10/21 by

Digital Tools and the Audio Archive: The Edge of Meaning

Reading is not just about taking time and thinking time, it is also a deeply visual experience
— Andrew Piper

Why, in the case of the ear, is their withdrawal and turning inward, a making resonant, but, in the case of the eye, there is manifestation and display, a making evident?
Jean-Luc Nancy

Since 2013, I’ve been working with SpokenWeb, a digital sound archive that features recordings from a poetry reading series that took place at Sir George Williams University (now Concordia) between 1966 and 1974. This project is invested in discerning “the poetry series” by investigating tools to facilitate critical engagement with recorded poetry recitation and performance — for reading sound. Listening (another form of reading) is a technologically informed activity, culturally rehearsed and historically specific, “always simultaneously a practice of visual interpretation” (Piper 388). How we listen is determined by the tools through which sound is transmitted. These tools control what we read and how we interpret it. While the SGWU Poetry Series is ripe with cultural, institutional, and literary history, as well as with the material, convivial, and circulatory implications of re-presenting archived audio recordings in a digital setting, not all of these facets are available for investigation.

Here’s Roy Kiyooka, one of the Poetry Series organizers, introducing Muriel Rukeyser in 1969:


And here’s Jason Camlot, SpokenWeb’s principle investigator, speaking about the recordings themselves in 2012 and how they became, to borrow from Moretti, “a way to ‘open up’ [one particular sphere of] literary history” (227):


I want to highlight Camlot’s refrain – that is, where he refers to the collection of reel-to-reel tapes, once digitized, as “a perfectly useless archive.” To be sure, Camlot’s discovery was major, as was the work of Concordia University’s Records Management and Archives personnel, who catalogued and preserved the tapes, which are by nature inching toward obsolescence (a point to which I will return): a collection of over 80 sound recordings from a Canadian poetry series featuring some of the most important figures in North American poetry, which took place amidst institutional growing pains, cultural transformations, and an uncertainty surrounding the identity of Canadian literature. Here is the SGW Poetry Series in (always partial) media/historical context:

  • Readings were held in one of three locations in the newly constructed Hall Building (Art Gallery, Basement Theatre, H-110).
  • Readings took place on Thursday, Friday, or Saturday evenings (a few exceptions).
  • Many of the earlier readings were captured using a Uher 4000 Report-L reel-to-reel tape recorder; the later ones, a Crown 800.
  • Recordings were made on either 7” or 5” reels, at speeds ranging from 3 ¾ to 7 ½ IPS (inches per second).
  • Many readings required more than one reel.
  • Many of the reels were edited before Camlot discovered them.
  • Recordings were originally commissioned by SGWU’s Instructional Media Office; later, the AV department.
  • Audio-visual wiring in the Hall Building made it possible for the readings to be recorded remotely.
  • Often, poets were escorted from the airport and taken for supper before their reading.
  • There were poet parties after many of the readings – but only those lucky enough to receive one of the handwritten invitations disseminated during a poet’s performance were allowed to attend.

This context is directly related to Camlot’s refrain and my role as a digital archivist/curator. It also maps nicely onto Moretti’s “Slaughterhouse of Literature” (the clues!) and inspires larger questions surrounding ideas of representation, authenticity, presence and absence in relation to how we “read” documentary sound material. The series tapes were a perfectly useless archive because they were inert documentary material: unknown speakers speaking to unknown audiences on unknown dates in unknown locations. Put another way, the series couldn’t be visualized. It couldn’t be discerned. It wasn’t available as an object of study. The SpokenWeb project can be “seen” as a visualization of documentary sound material. Again, I nod to the good fine folks at ConU’s Records Management and Archives, who, by cataloguing, preserving, and digitizing the series tapes (not to mention their ongoing collaborative efforts, which I will allude to in a moment), have built a material platform upon which the site could be constructed and maintained. It is not the archivist’s job to provide context. It’s ours – a task that, again, would be much more difficult without the archivists’ hard work and guidance, for it is within the archive itself that most of our clues have been (and continue to be) uncovered:

  • back issues of The Georgian, which contain press releases that provide dates, times, locations, reviews and so forth:

G1966-10-12-p6

  • event posters illustrating how the series was divided over its nine year run (i.e. Poetry Six, 1971-72 academic year), an alternate way to visualize the series over time:

Poetry 6 Poster

  • the tape boxes themselves, which often included notes describing a tape’s content, such as which poems were read, or what materials were used to record the event:
    I0006_11_0089-2_tape4 5 and 6_FR Scott note_I006SR112
  • and equipment requisition slips, which gave us some media perspective:

19_McClure-requisition_I006SR160-300x130

We have also incorporated an oral literary history element into the project by conducting interviews with some of the series organizers, poets who read in the series, audience members who attended the readings, and a technical operator who worked for SGWU during the series. However, by and large our context has been generated vis-à-vis archival research – through the accumulation of clues – “a ‘specific device’ of exceptional visibility” (Moretti 212) – an always ongoing classification of evidence, a seeing of sound.

Since the early stages of the SpokenWeb project there have been suspicions about comprehensiveness. Many of the clues we’ve uncovered point to date, time and location conflicts (information overlaps, omissions, and contradictions). There is even a Georgian press release that suggests the series did not in fact come to an end in 1974. There is also a gap in recordings between 1973 (in which there are zero) and 1974 (in which there are two) that further suggests (a) that some readings were not recorded, or (b) that they were recorded but  for whatever reason were not included in the collection that Camlot discovered in the Chair’s office in 1999.

I want to bookmark a few questions. How should we think about the ways in which representation affects the status of cultural objects? These ‘unrepresented’ readings are unseen and unheard (they are catalogue numbers for tapes in small boxes in big boxes in a building in a city) but are they any less ‘present’ than those that are visible/audible? Are they any more authentic? What is a sound recording’s temporal status? How can we pin something down when it is superimposed in time?

Last week, while combing a section of Concordia’s AV Database (a real treat to navigate), I stumbled upon a familiar name, one that I had seen twice a few months earlier, first on a 1973 “mediafax requisition” slip, and second on a 1973 press release form. That name was Tom Marshall.

20_Poetry 7 requisition_I006SR02024_Tom Marshall info I006SR020

I pulled up the press release form to crosscheck the information. It was a match. The recording existed. Tom Marshall was stirring. His status was changing. At the bottom of the press release form there is a “Subsequent Readings” header, under which there are two additional names – Dennis Lee and Michael Benedikt. These names were also familiar. I seemed to remember having seen Lee’s name on one of the infamous after-party invitation slips, and having seen Benedikt’s on one of George Bowering’s “propaganda sheets” (the typewritten and manually disseminated equivalent of a press release form).

Dennis Lee invitationPoetry 7 - Benedikt Propaganda Slip

I went through my archival scans, found these artifacts, and compared the names and dates with those from the AV database. Also a match.

That day, I uncovered 20-30 recordings between 1969 and 1975, many of which I’d suspected, others featuring poets who are familiar but hitherto unrelated to the series. I had one major question: how could so many recordings have been left undiscovered for so long? They weren’t exactly hiding. So why had they not been digitized? I sent an email to Archivist and Records Officer Vincent Oulette, and received an answer: acetate.

The Poetry Series recordings were made using two different kinds of magnetic tape: acetate and polyester. Due to a lack of financial resources when the tapes were commissioned for digitization, priority was given to the acetate reels, which were (rightly) considered to be more in ‘danger’ of obsolescence than the polyester tapes. Therefore, it can no longer be assumed that the series tapes were digitized systematically – the digitization project was one of material preservation, not cultural posterity. Nevertheless, the reproduced voices of Lee, Marshall, Benedikt and a gang of other poets have been heard – and they are perfectly useless. It’s the SpokenWeb team’s task to stitch them into the SGWU Poetry Series fabric – “generated by clues—by their absence, presence, necessity, [and] visibility” (Moretti 217) – whereby we might “[turn] the story into something more than the sum of its parts: a structure” (218).

 Works Cited

 ——- “Beyond the Text: Literary Archives in the 21st Century.” Yale University. Beinecke Library, New Haven, CT. April 2013. MP3. Panel discussion.

Kiyooka, Roy. “Phyllis Webb at SGW, 1966 (with Gwendolyn MaCewen).” SpokenWeb, 2010. Mp3. Web. 1 Sept. 2014.

Moretti, Franco. “The Slaughterhouse of Literature.” MLQ: Modern Language Quarterly 6.1 (March 2000): 207-227. Print.

Nancy, Jean-Luc. Listening. New York: Fordham University Press, 2007. Print.

Piper, Andrew. “Reading’s Refrain: From Bibliography to Topology.” English Literary History 80 (2013): 373-399. Print.

SpokenWeb. Concordia University. 2010. Web. 1 Sept. 2014.

Newer Posts
Older Posts